
Modern Data Pipeline Implementation with PAASUP DIP: Subway User Statistics Analysis Project #3
Analyzing Urban Transportation Patterns with Seoul Subway Hourly Boarding and Alighting Data
Project Overview
The Seoul subway network is South Korea's largest urban railway system, serving over 7 million citizens daily.
This project implements the 'Rush Hour Pattern Analysis through Hourly Data Acquisition' task that was proposed as a future development plan in a previous blog post.
The goal is to build an intelligent dashboard system that can analyze citizens' movement patterns and traffic congestion by processing over 10 years of subway boarding and alighting data from the Public Data Portal using modern data lake technology stack.
Table of Contents
- Original Data Structure
- Data Pipeline Construction
- Dashboard Development
- Business Insights
- Conclusion
📋Original Data Structure
- Filename: Seoul Subway Line-wise Station-wise Hourly Boarding and Alighting Information.json
- Source: Public Data Portal
- Scale: 73,692 records
- Time Range: Monthly/Line-wise/Station-wise hourly (00:00-24:00) boarding and alighting information
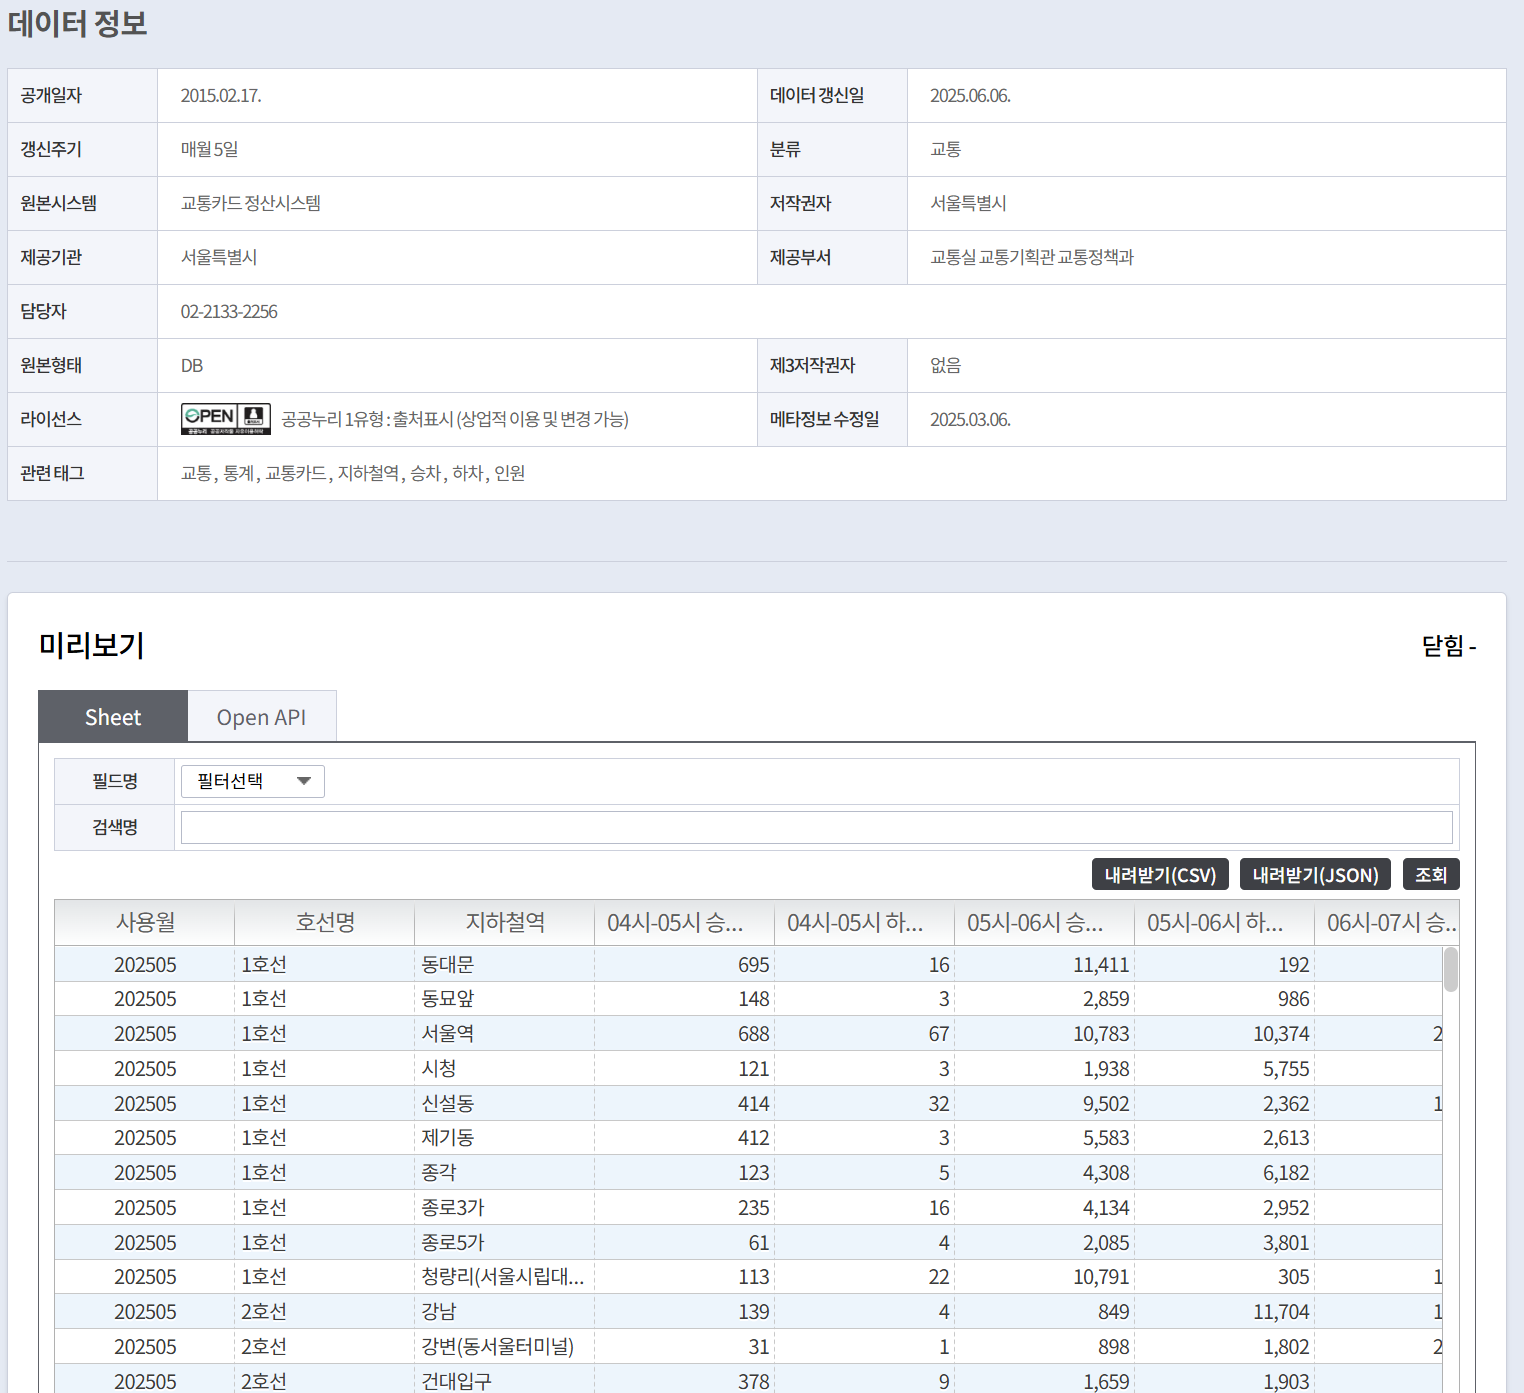
The original JSON data contains hourly boarding/alighting passenger counts for each station over 24 hours, consisting of the following key fields:
{
  "USE_MM": "Usage Month",
  "SBWY_ROUT_LN_NM": "Line Name",
  "STTN": "Subway Station",
  "HR_7_GET_ON_NOPE": "07:00-08:00 Boarding Passengers",
  "HR_7_GET_OFF_NOPE": "07:00-08:00 Alighting Passengers",
  // ... All 24 hourly time slots
}
⚙️Data Pipeline Construction
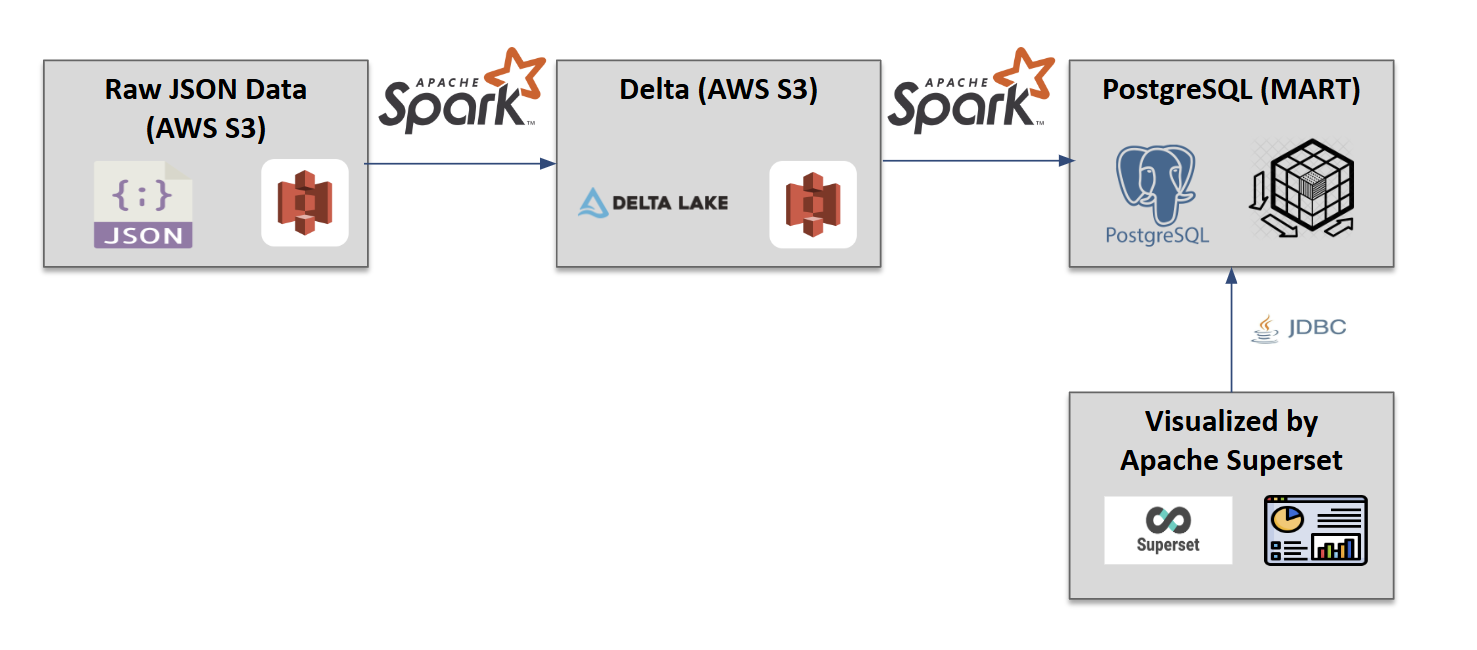
Architecture Design
This project implements a modern, scalable, and performance-optimized data lakehouse architecture. We adopted a multi-layered structure that stores original JSON data in cloud storage, converts it to Delta Lake format to support ACID transactions and schema evolution, and finally connects to relational databases and BI tools.
The entire data pipeline (excluding visualization) is implemented through Apache Spark Operator, ensuring stable and scalable data processing in a distributed processing environment.
Technology Stack:
- Data Processing: Apache Spark
- Data Storage: Delta Lake, PostgreSQL
- Visualization: Apache Superset
- Development Environment: Jupyter Notebook
- Platform: DIP Portal
Data Normalization Process
We transformed the original JSON's wide format data into long format suitable for analysis:
Before Transformation (Wide Format): JSON file or Delta table schema
Usage Year-Month | Line Name | Subway Station | HR_7_GET_ON | HR_7_GET_OFF | HR_8_GET_ON | HR_8_GET_OFF | ...
After Transformation (Long Format): PostgreSQL table schema
CREATE TABLE subway_passengers_time (
    use_ym VARCHAR(6),           -- Usage Year-Month
    line_no VARCHAR(100),        -- Line Name
    station_name VARCHAR(100),   -- Station Name
    time_term VARCHAR(20),       -- Time Period
    pass_in NUMERIC(12),         -- Boarding Passengers
    pass_out NUMERIC(12),        -- Alighting Passengers
    reg_date VARCHAR(8),         -- Registration Date
    PRIMARY KEY (use_ym, line_no, station_name, time_term)
);
Final Data Scale: 1,768,608 records over 10 years and 4 months
Data Pipeline Implementation
The core code of the data pipeline using Spark is as follows:
def subway_data_time_overwrite(spark, s3_config, pg_config, json_file):
    """
    Main pipeline for processing subway passenger hourly data
    Processes data in the order: JSON source data → Delta Lake → PostgreSQL

    Args:
        spark: Spark session object
        s3_config: S3 configuration (bucket, access_key, secret_key, etc.)
        pg_config: PostgreSQL configuration (host, port, dbname, user, password)
        json_file: JSON filename to process
    """

    # Generate PostgreSQL JDBC connection URL
    pg_url = f"jdbc:postgresql://{pg_config['host']}:{pg_config['port']}/{pg_config['dbname']}"

    # Set PostgreSQL connection properties
    pg_properties = {
        "user": pg_config['user'],
        "password": pg_config['password'],
        "driver": "org.postgresql.Driver"
    }

    print(f" bucket name is {s3_config['bucket']}")

    # Define S3 file paths
    json_source_key = f"datasource/{json_file}"  # Original JSON file path
    json_archive_key = f"archive/{json_file}"    # Archive path after processing
    json_file_path = f"s3a://{s3_config['bucket']}/{json_source_key}"  # Full S3 file path

    # Delta Lake table storage path
    delta_table_path = f"s3a://{s3_config['bucket']}/deltalake/subway_passengers_time"

    # PostgreSQL table name
    pg_table_name = "subway_passengers_time"

    try:
        # =================================================================
        # Step 1: Read JSON file from S3 and create DataFrame
        # =================================================================
        print(f"Reading JSON file from S3: {json_file_path}...")

        # Read as raw text to handle special JSON structure
        # Actual data is stored as an array inside the "DATA" key of JSON
        raw_json_rdd = spark.sparkContext.textFile(json_file_path)

        # Combine all lines of RDD into one string
        raw_json_string = "".join(raw_json_rdd.collect())

        # Parse JSON string to Python dictionary
        data_dict = json.loads(raw_json_string)

        # Extract actual data record list from 'DATA' key
        records = data_dict.get("DATA")
        if not records:
            print("Error: 'DATA' key not found in JSON or is empty.")
            return

        # Create Spark DataFrame from extracted record list
        df_json = spark.createDataFrame(records)

        # =================================================================
        # Step 2: Save data to Delta Lake (overwrite mode)
        # =================================================================
        print(f"Saving data to Delta Lake table: {delta_table_path}")

        # Save data to Delta Lake in overwrite mode
        df_json.write.format("delta").mode("overwrite").save(delta_table_path)
        print("Data saved to Delta Lake table successfully")


        # =================================================================
        # Step 3: Move processed JSON file to archive folder
        # =================================================================
        print(f"Moving processed JSON file to archive folder...")
        move_s3_file(s3_config, json_source_key, json_archive_key)

        # =================================================================
        # Step 4: Transform Delta Lake data and load into PostgreSQL
        # =================================================================
        print(f"Inserting data into PostgreSQL table: {pg_table_name}")

        # Implement UNPIVOT operation using UNION ALL to convert hourly columns (hr_0~hr_23) to rows
        # Original data: 1 row with 24 hourly columns
        # After transformation: 24 rows with separate data for each hour
        insert_sql = f"""
                        -- 00:00-01:00 boarding/alighting data
                        select use_mm use_ym               -- Usage Year-Month
                             , sbwy_rout_ln_nm line_no      -- Subway Line Name
                             , sttn station_name            -- Station Name
                             , '00시-01시' time_term        -- Time Period
                             , hr_0_get_on_nope pass_in     -- Boarding Passengers
                             , hr_0_get_off_nope pass_out   -- Alighting Passengers
                             , job_ymd reg_date             -- Registration Date
                          from delta.`{delta_table_path}`
                        union all
                        -- 01:00-02:00 boarding/alighting data
                        select use_mm use_ym
                             , sbwy_rout_ln_nm line_no
                             , sttn station_name
                             , '01시-02시' time_term
                             , hr_1_get_on_nope pass_in
                             , hr_1_get_off_nope pass_out
                             , job_ymd reg_date
                          from delta.`{delta_table_path}`
                        union all
                        ...
                    """


        # Execute Spark SQL to create transformed DataFrame
        delta_df = spark.sql(insert_sql)

        # Write data to PostgreSQL (overwrite mode: delete existing data and load new data)
        delta_df.write \
            .jdbc(url=pg_url,
                  table=pg_table_name,
                  mode="overwrite",
                  properties=pg_properties)

        print(f"Data loading to PostgreSQL table {pg_table_name} completed")

        print(f"--- All processing completed successfully! ---")

    except Exception as e:
        print(f"Error occurred during data processing: {e}")
        import traceback
        traceback.print_exc()  # Output detailed error stack trace
Key Implementation Points:
- Dynamic Column Processing: Dynamically convert 24-hour boarding/alighting data to Long Format
- Delta Lake Utilization: Support for ACID transactions and schema evolution
- Distributed Processing: Efficient processing of large volumes of data with Spark's distributed computing
- Data Quality: Ensure data integrity through deduplication and aggregation
📊Dashboard Development
We built two main dashboards using Apache Superset.
Dashboard 1: Detailed Hourly Congestion Analysis
Objective: Propose optimal travel times through analysis of hourly boarding/alighting patterns for specific periods, lines, and stations
Key Features:
- Dynamic Filtering: Multiple selection for inquiry period, line names, and station names
- Real-time Analysis: Immediate chart updates based on user selections
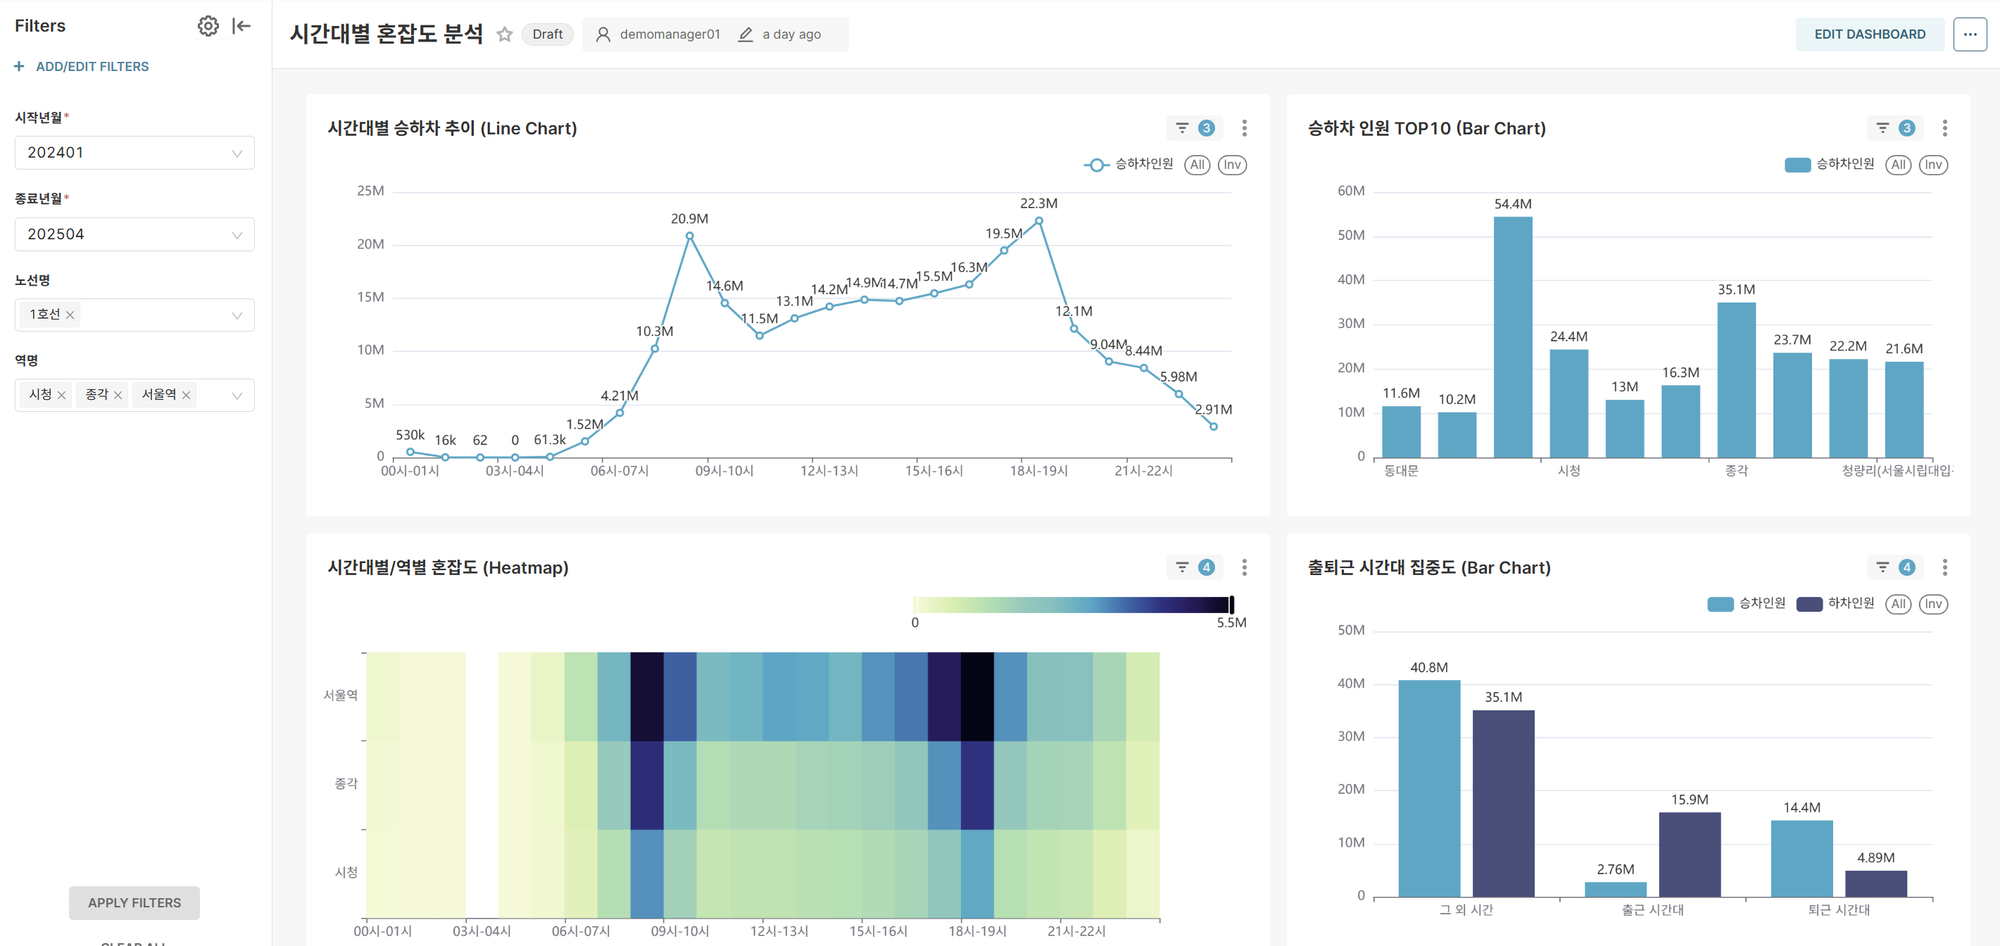
Core Charts:
-
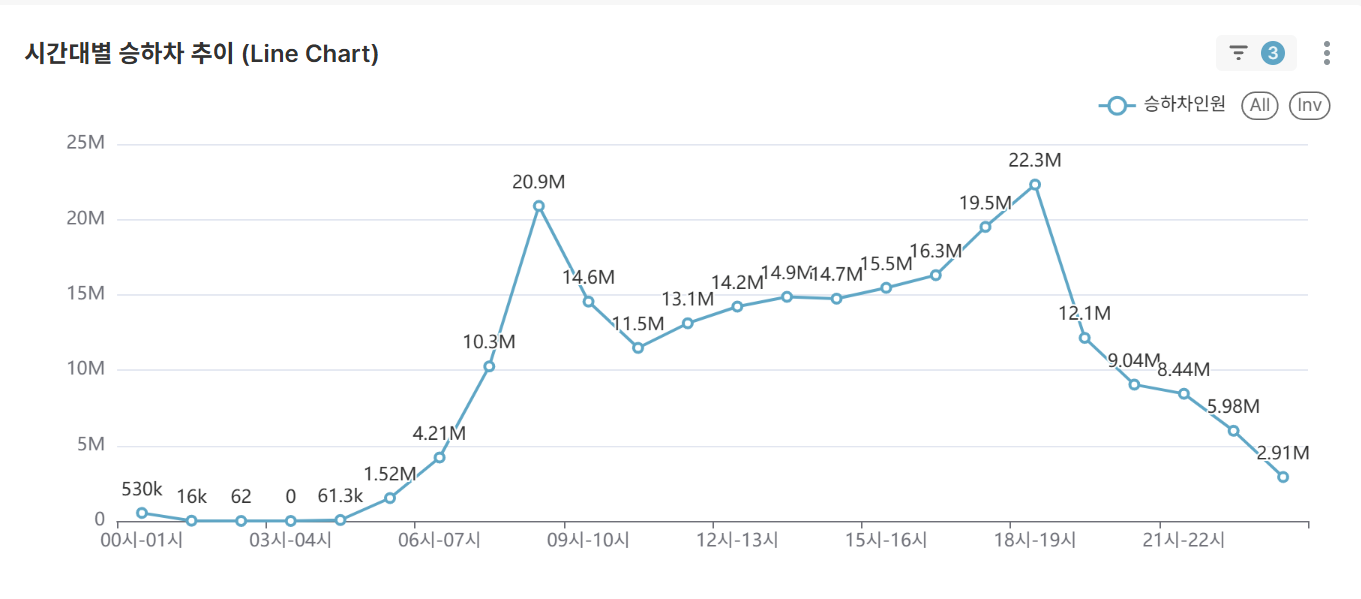
Hourly Average Boarding/Alighting Trends (Line Chart)
- Visualize hourly average boarding/alighting patterns for selected conditions
- Identify rush hours and off-peak periods
-
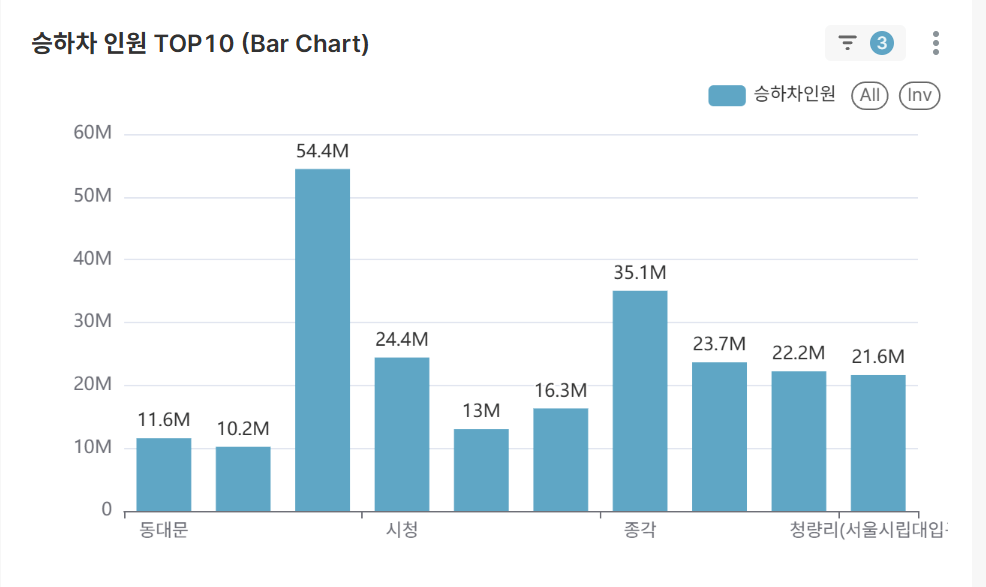
TOP 10 Stations by Boarding/Alighting Volume (Bar Chart)
- Ranking of the 10 busiest stations under selected conditions
- Identify major transportation hub stations
-
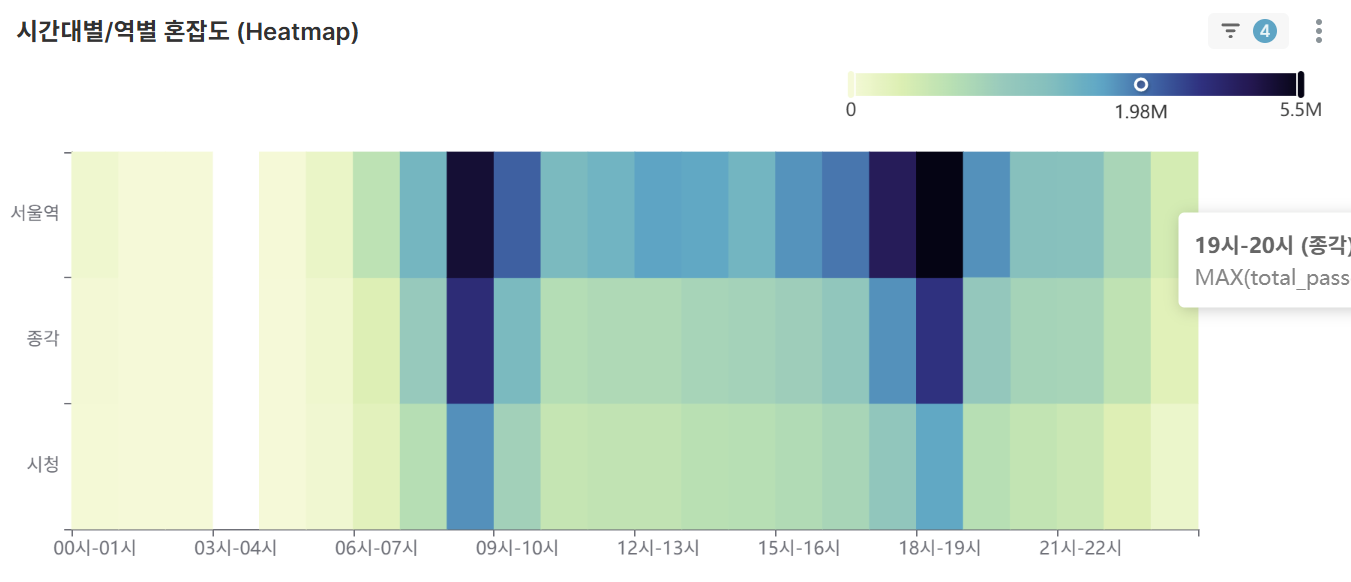
Hourly/Station-wise Congestion Heatmap (Heatmap)
- At-a-glance view of time-station congestion levels in a 2D matrix for selected station conditions
- Intuitive representation of congestion levels through color intensity
-
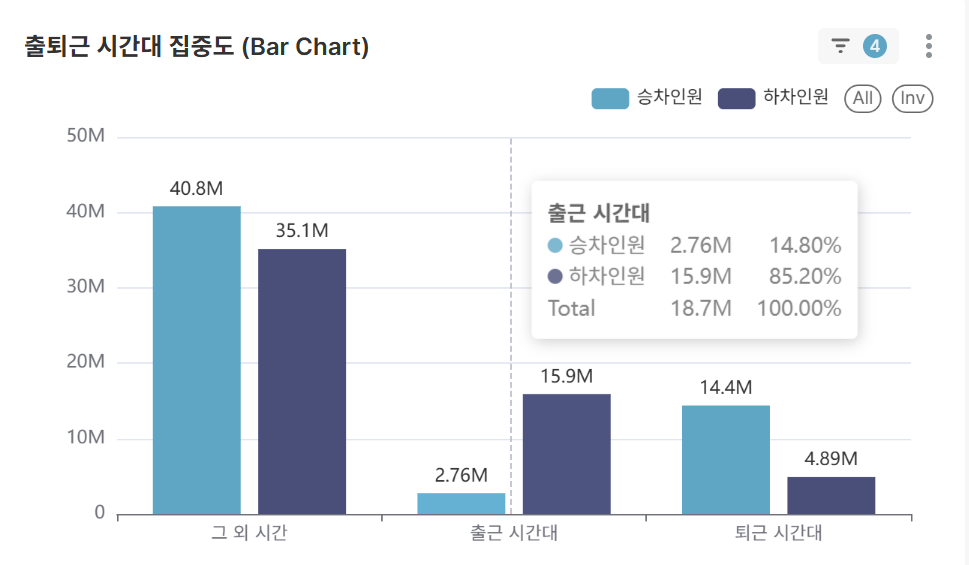
Rush Hour Concentration Analysis (Bar Chart)
- Passenger distribution between rush hours (07-09, 18-20) vs other time periods for selected station conditions
- Quantitative analysis of traffic concentration
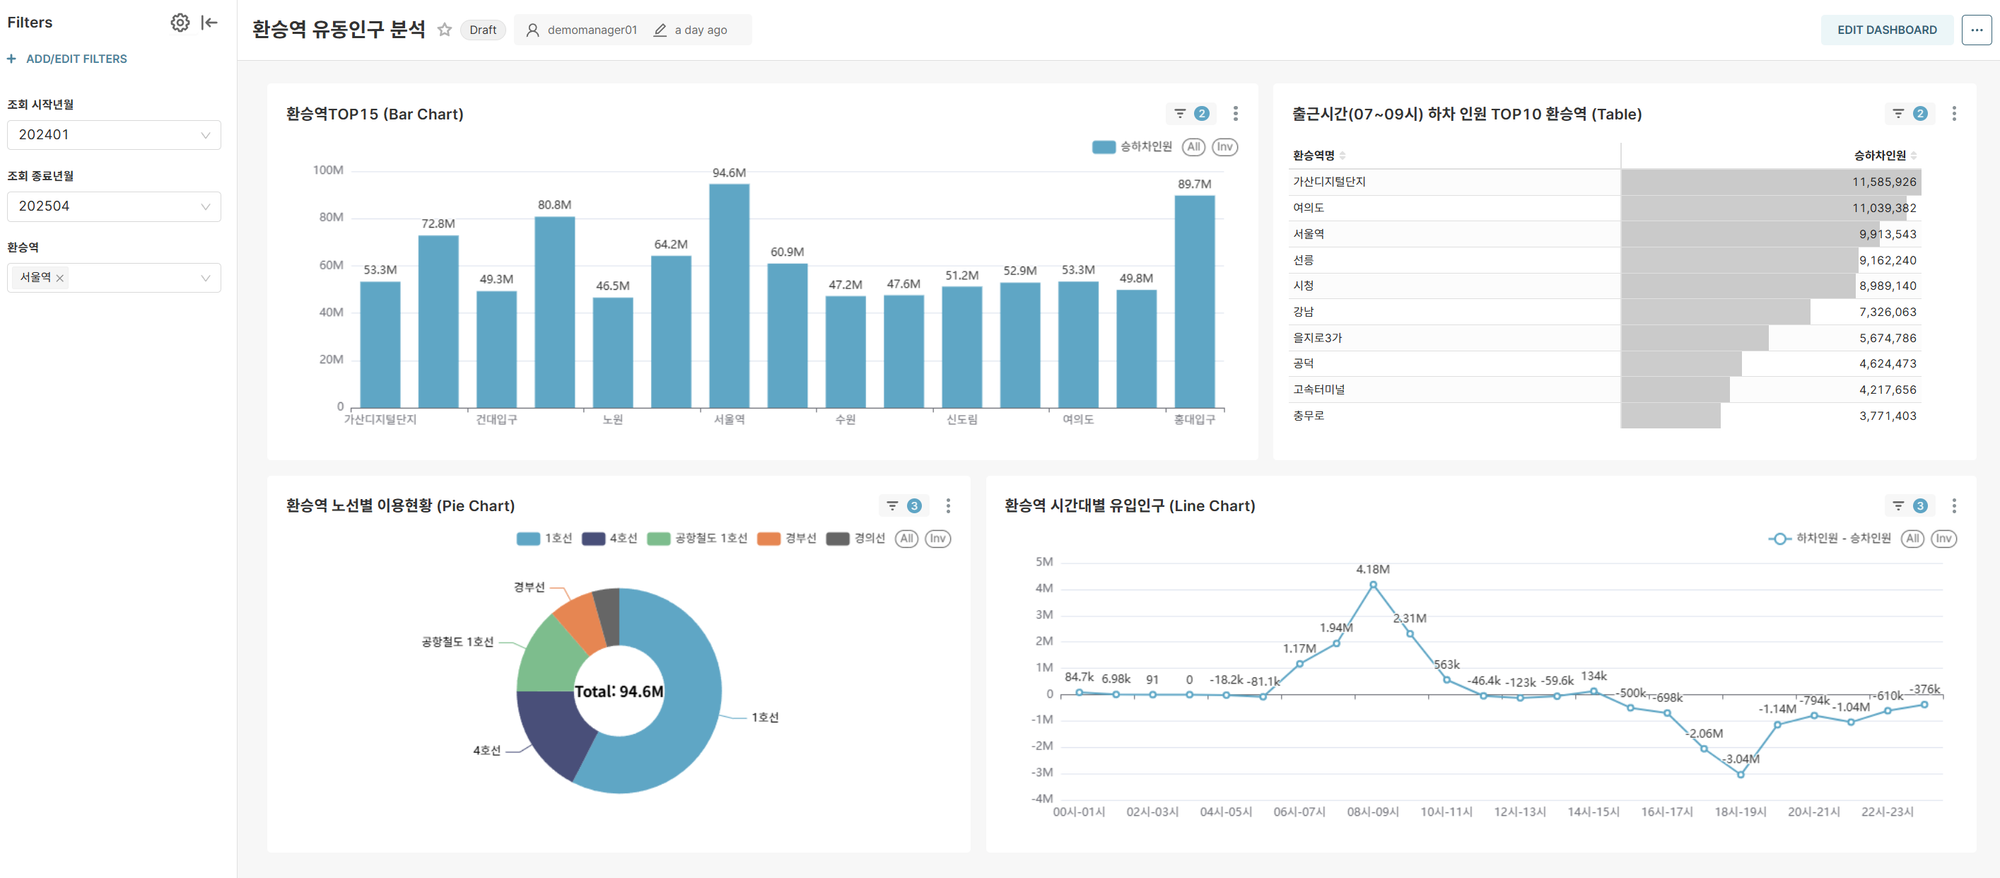
Dashboard 2: Transfer Station-Centered Floating Population Analysis
Objective: In-depth analysis of major transfer stations' role as transportation hubs and inter-line connectivity
Key Features:
- Dynamic Filtering: Multiple selection for inquiry period and transfer stations
- Real-time Analysis: Immediate chart updates based on user selections
Core Insights:
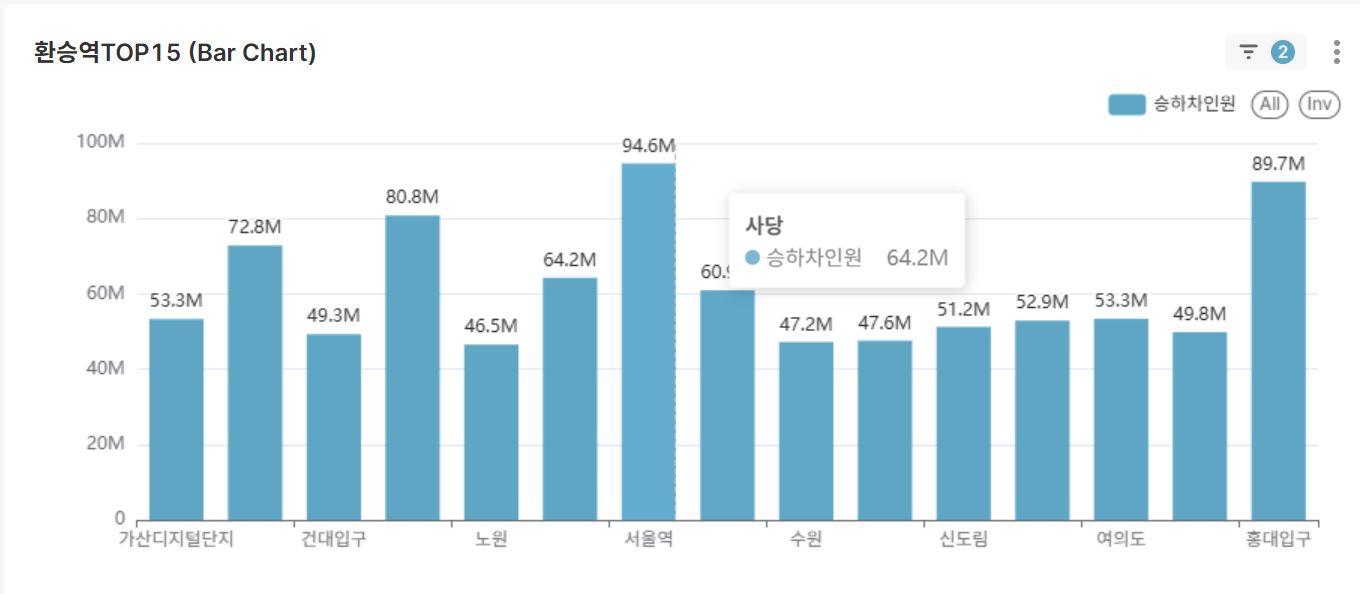
-
Top 15 Transfer Stations in South Korea (Bar Chart)
- Major transfer station rankings based on total ridership over the entire period
- Identify core nodes of national transportation infrastructure
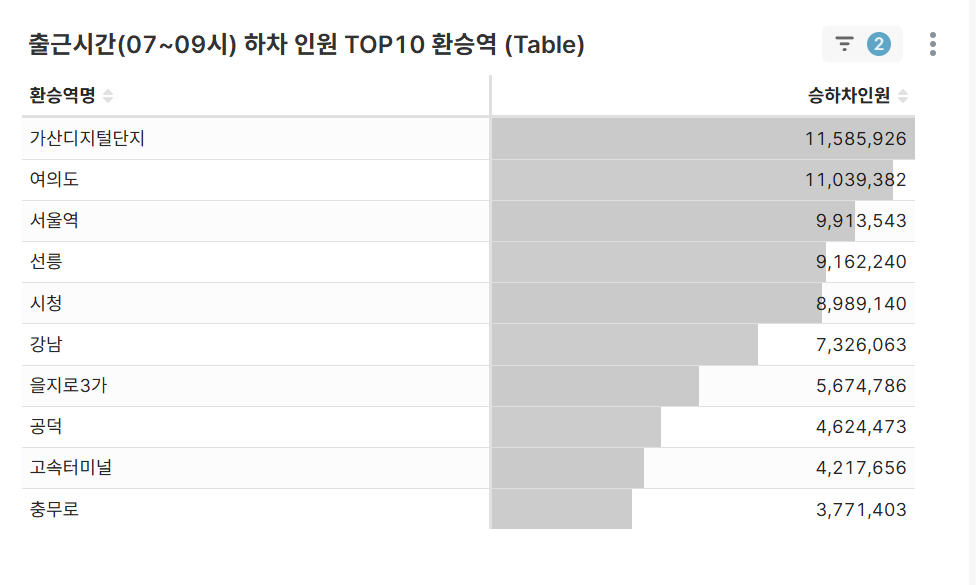
-
TOP 10 Transfer Stations by Morning Alighting Volume (Table)
- Analysis of transfer stations with concentrated alighting during 07-09 hours
- Identify transfer stations connecting major business districts
-
Hourly Net Inflow Population Analysis for Transfer Stations (Line Chart)
- Net inflow (alighting passengers - boarding passengers) analysis for selected transfer station conditions
Positive (+): Destination characteristics (business districts)
Negative (-): Origin characteristics (residential areas) - Quantitative analysis of functional characteristics (residential/business) of selected transfer stations
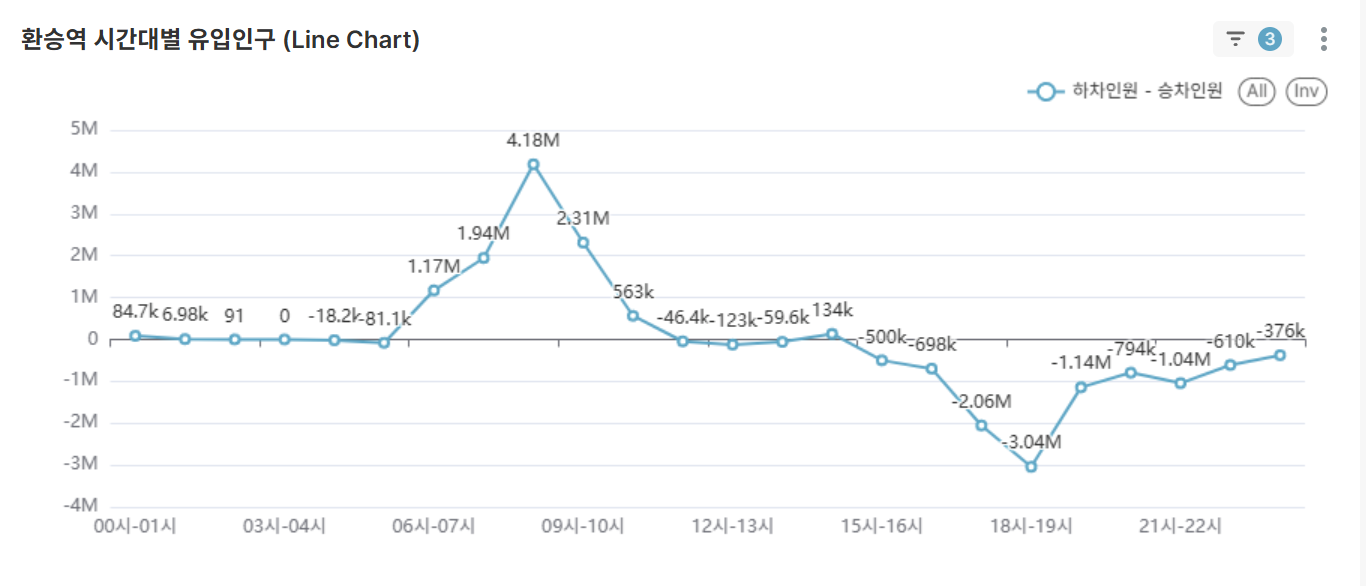
- Net inflow (alighting passengers - boarding passengers) analysis for selected transfer station conditions
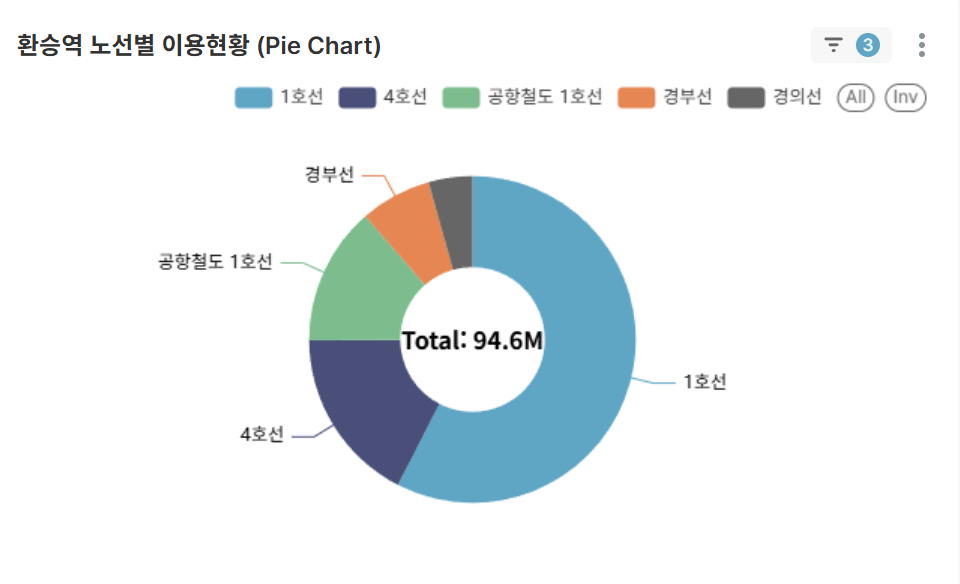
-
Line-wise Contribution at Transfer Stations (Pie Chart)
- Usage proportion of each line within selected transfer stations
- Distinguish between main lines and auxiliary lines
📈Business Insights
-
Rush Hour Concentration Phenomenon
- About 40% of total passengers concentrated during 07-09 and 18-20 hours
- Concentrated alighting at business centers like Gangnam Station and Jamsil Station
-
Transfer Station Hub Effect
- Top 5 transfer stations handle 25% of total traffic volume
- Differentiated usage patterns according to line-specific characteristics
-
Regional Characteristic Analysis
- Residential areas: Morning boarding, evening alighting concentration
- Business areas: Morning alighting, evening boarding concentration
🚀Conclusion
Through this project, we confirmed that simple boarding and alighting data can become a powerful tool for understanding citizens' lifestyle patterns and urban structure.
By utilizing modern data pipelines and visualization tools, we were able to maximize the value of public data and derive insights that can improve citizens' transportation convenience.