
No-ETL Data Pipeline Using StarRocks MViews
Discover how to integrate diverse data sources in real-time using StarRocks Materialized Views without complex ETL. This guide covers complete pipeline implementation from data loading to visualization, featuring StarRocks and Apache Iceberg scenarios for cost reduction and high performance.
Introduction
Traditional ETL (Extract, Transform, Load) processes involve complex pipeline configurations and high operational costs. By leveraging StarRocks' Materialized View functionality, you can implement an efficient architecture that integrates and analyzes various source data in real-time without such complexity.
StarRocks' core strength lies in its ability to utilize Materialized Views not only with internal data but also with heterogeneous databases and Data Lake file-format data through External Catalogs.
This guide provides a step-by-step walkthrough of creating Materialized Views using StarRocks and Apache Iceberg as source data in two different scenarios, implementing a complete data pipeline from data integration to visualization.
Dataset Used: New York City Traffic Crash Data (NYPD_Crash_Data.csv)
Data Source: StarRocks Official Website Quickstart Example
Table of Contents
- StarRocks Environment Setup
- Data Loading
- External Catalog Configuration
- Materialized View Implementation
- Apache Superset Integration and Data Visualization
- Conclusion and Future Directions
StarRocks Environment Setup
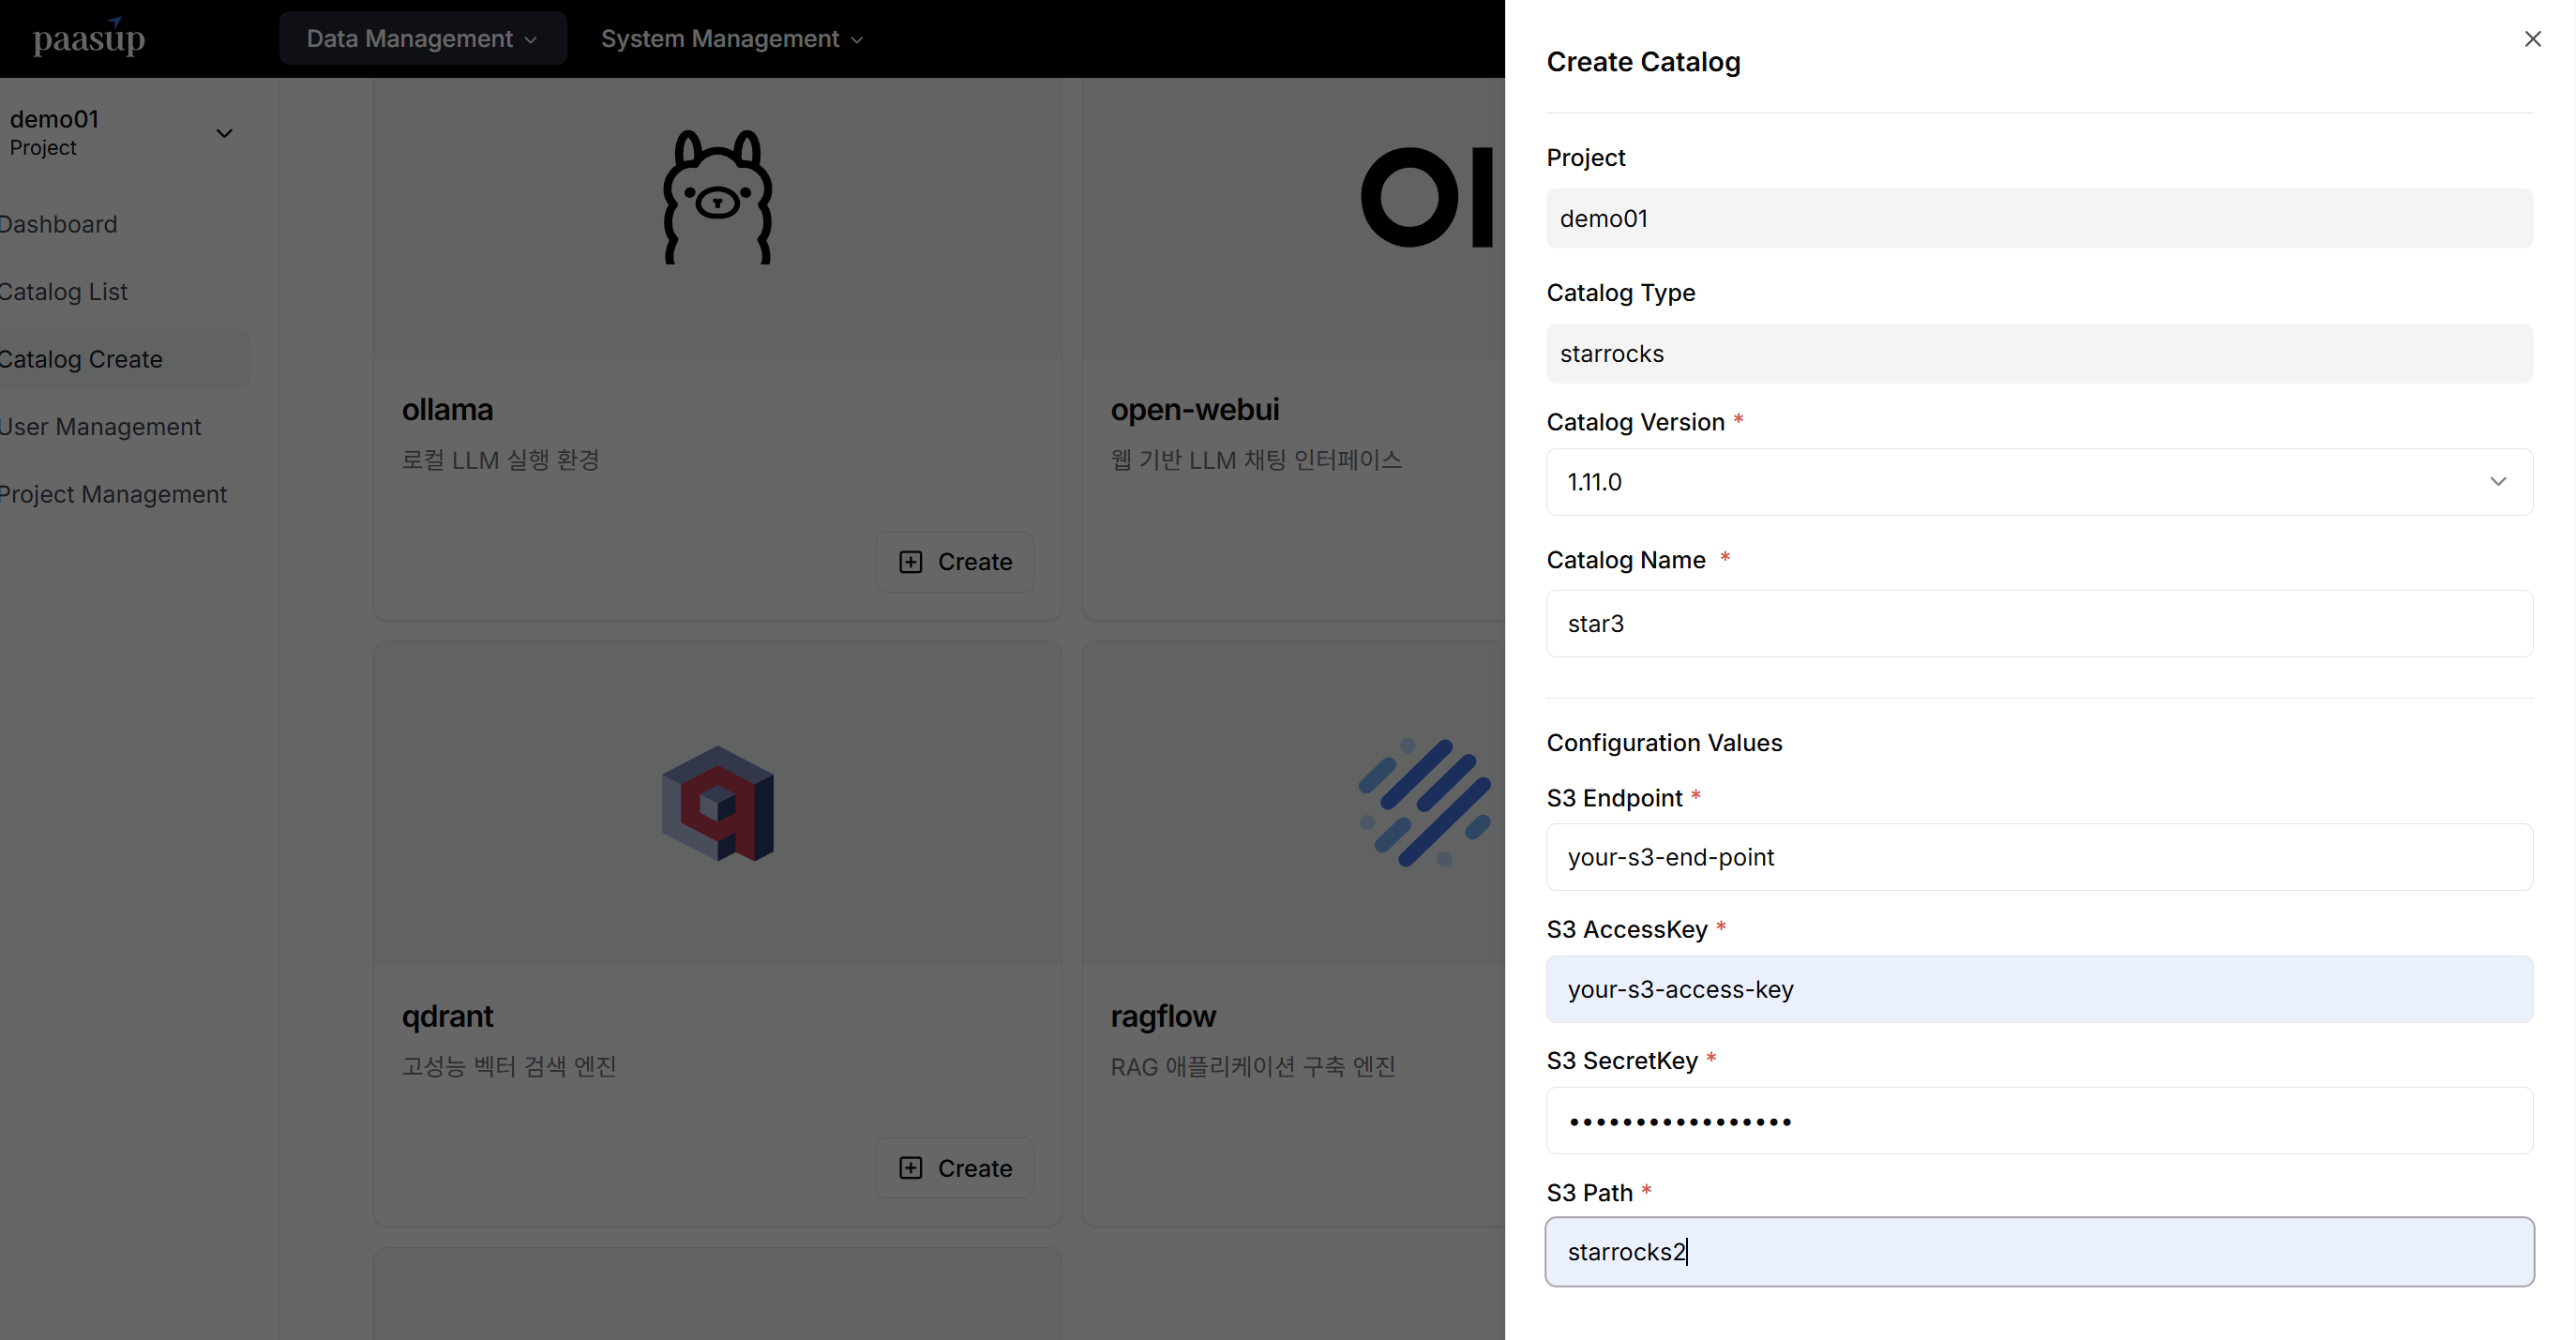
Catalog Creation
Click the StarRocks [Create] button in the DIP Portal's catalog creation menu, then input the required configuration information (version, name, S3 settings) to deploy the cluster.
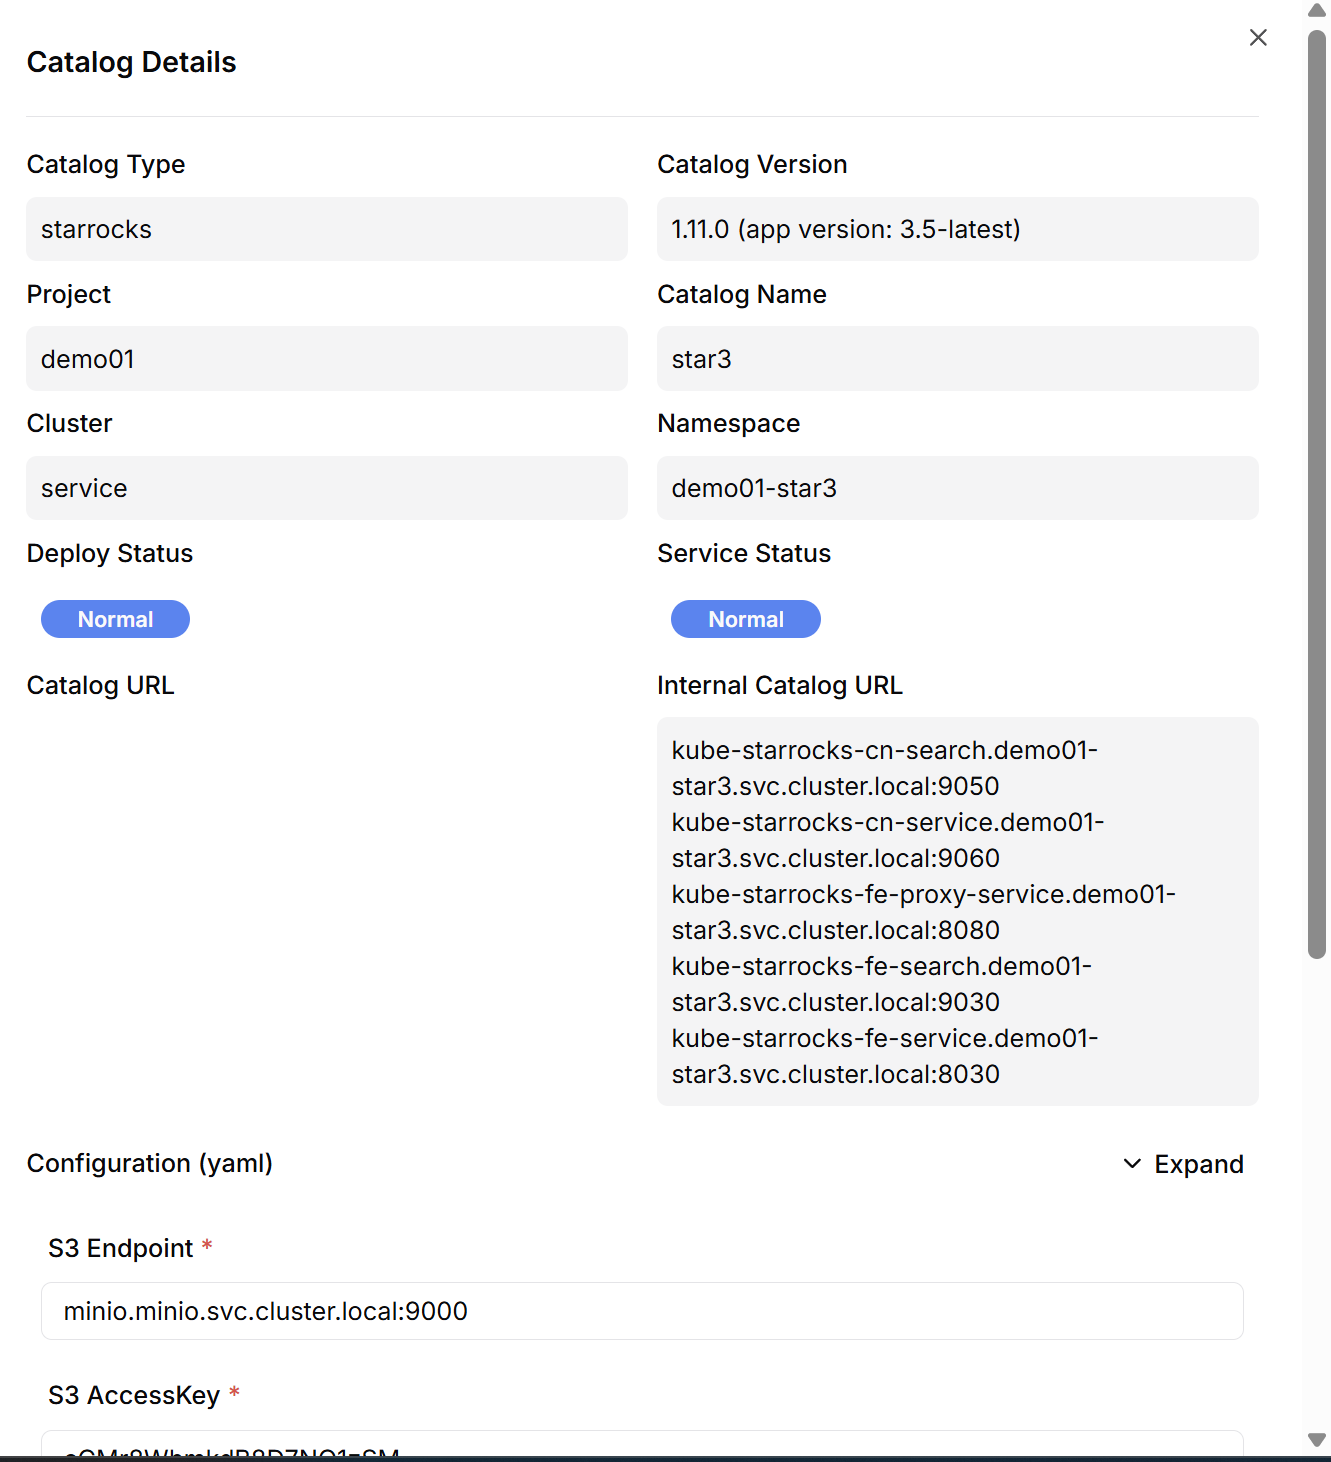
Cluster Information Verification
Click the [View] button of the created catalog to check the connection addresses for Compute Node (CN) and Front End (FE) pods.
Data Loading
StarRocks Internal Table Loading
Table Schema Definition
CREATE TABLE IF NOT EXISTS crashdata (
    CRASH_DATE DATETIME,
    BOROUGH STRING,
    ZIP_CODE STRING,
    LATITUDE INT,
    LONGITUDE INT,
    LOCATION STRING,
    ON_STREET_NAME STRING,
    CROSS_STREET_NAME STRING,
    OFF_STREET_NAME STRING,
    CONTRIBUTING_FACTOR_VEHICLE_1 STRING,
    CONTRIBUTING_FACTOR_VEHICLE_2 STRING,
    COLLISION_ID INT,
    VEHICLE_TYPE_CODE_1 STRING,
    VEHICLE_TYPE_CODE_2 STRING
);
Data Loading via Stream Load API
Using StarRocks' Stream Load API, you can efficiently load large CSV files with simple curl commands.
curl --location-trusted -u root:<your-password> \
    -T NYPD_Crash_Data.csv \
    -H "column_separator:," \
    -H "skip_header:1" \
    -H "enclose:\"" \
    -H "max_filter_ratio:1" \
    -H "columns:tmp_CRASH_DATE, tmp_CRASH_TIME, CRASH_DATE=str_to_date(concat_ws(' ', tmp_CRASH_DATE, tmp_CRASH_TIME), '%m/%d/%Y %H:%i'),BOROUGH,ZIP_CODE,LATITUDE,LONGITUDE,LOCATION,ON_STREET_NAME,CROSS_STREET_NAME,OFF_STREET_NAME,NUMBER_OF_PERSONS_INJURED,NUMBER_OF_PERSONS_KILLED,NUMBER_OF_PEDESTRIANS_INJURED,NUMBER_OF_PEDESTRIANS_KILLED,NUMBER_OF_CYCLIST_INJURED,NUMBER_OF_CYCLIST_KILLED,NUMBER_OF_MOTORIST_INJURED,NUMBER_OF_MOTORIST_KILLED,CONTRIBUTING_FACTOR_VEHICLE_1,CONTRIBUTING_FACTOR_VEHICLE_2,CONTRIBUTING_FACTOR_VEHICLE_3,CONTRIBUTING_FACTOR_VEHICLE_4,CONTRIBUTING_FACTOR_VEHICLE_5,COLLISION_ID,VEHICLE_TYPE_CODE_1,VEHICLE_TYPE_CODE_2,VEHICLE_TYPE_CODE_3,VEHICLE_TYPE_CODE_4,VEHICLE_TYPE_CODE_5" \
    -XPUT http://<your-fe-domain>:8030/api/quickstart/crashdata/_stream_load
Data Loading Results Verification
The original dataset contains approximately 420,000 records, which were repeatedly loaded to increase the total data volume for Materialized View testing.
Apache Iceberg Table Loading
For creating Iceberg tables and loading data, integration with a metastore (Hive, Glue, RDB, etc.) is essential. This is a prerequisite for creating External Catalogs in StarRocks.
import os
import pandas as pd
import pyarrow as pa
from pyiceberg.catalog import load_catalog
from pyiceberg.exceptions import NoSuchTableError, NamespaceAlreadyExistsError
from pyiceberg.schema import Schema
from pyiceberg.types import (
    NestedField,
    StringType,
)
from thrift.transport import TSocket, TTransport
from thrift.protocol import TBinaryProtocol
from hive_metastore import ThriftHiveMetastore

# Hive Metastore connection settings
hive_uri = 'thrift://<your-hive-uri>:<port>'
minio_endpoint = '<your-endpoint>:<port>'
minio_access_key = '<your-access-key>'
minio_secret_key = '<your-secret-key>'
s3_warehouse_path = '<your-warehouse-path>'

# PyIceberg catalog initialization
catalog_properties = {
    "uri": hive_uri,
    "warehouse": s3_warehouse_path,
    "s3.endpoint": minio_endpoint,
    "s3.access-key-id": minio_access_key,
    "s3.secret-access-key": minio_secret_key,
}

try:
    catalog = load_catalog("hive", **catalog_properties)
    print("Hive catalog connection successful")
except Exception as e:
    print(f"Catalog connection failed: {str(e)}")
    raise

# CSV data preprocessing
print("Reading and preprocessing NYPD_Crash_Data.csv file...")

df = pd.read_csv('NYPD_Crash_Data.csv', on_bad_lines='skip', low_memory=False)

# Column name normalization (lowercase conversion, replace spaces with underscores)
df.columns = [col.lower().replace(' ', '_') for col in df.columns]

# Select key columns for analysis
columns_to_keep = [
    'crash_date', 'crash_time', 'borough', 'zip_code', 'latitude', 'longitude',
    'on_street_name', 'number_of_persons_injured', 'contributing_factor_vehicle_1', 'vehicle_type_code_1'
]
df = df[columns_to_keep].copy()

# Data type standardization (convert all columns to string)
df.fillna('', inplace=True)
for col in df.columns:
    df[col] = df[col].astype(str)

print("Data preprocessing completed")
print("Sample data verification:")
print(df.head())

# Iceberg table schema definition
schema = Schema(
    NestedField(field_id=1, name="crash_date", field_type=StringType(), required=False),
    NestedField(field_id=2, name="crash_time", field_type=StringType(), required=False),
    NestedField(field_id=3, name="borough", field_type=StringType(), required=False),
    NestedField(field_id=4, name="zip_code", field_type=StringType(), required=False),
    NestedField(field_id=5, name="latitude", field_type=StringType(), required=False),
    NestedField(field_id=6, name="longitude", field_type=StringType(), required=False),
    NestedField(field_id=7, name="on_street_name", field_type=StringType(), required=False),
    NestedField(field_id=8, name="number_of_persons_injured", field_type=StringType(), required=False),
    NestedField(field_id=9, name="contributing_factor_vehicle_1", field_type=StringType(), required=False),
    NestedField(field_id=10, name="vehicle_type_code_1", field_type=StringType(), required=False),
)

# Table creation and data loading
db_name = "nyc_db"
table_name = "crashes"
table_identifier = (db_name, table_name)

# Namespace creation
try:
    catalog.create_namespace(db_name)
    print(f"Namespace '{db_name}' created successfully")
except NamespaceAlreadyExistsError:
    print(f"Namespace '{db_name}' already exists")

try:
    # Check existing table and append data
    table = catalog.load_table(table_identifier)
    print(f"Existing table '{db_name}.{table_name}' found, appending data...")

    arrow_table = pa.Table.from_pandas(df)
    table.append(arrow_table)
    print("Data appended to existing table successfully")

except NoSuchTableError:
    # Create new table and load data
    print(f"Creating table '{db_name}.{table_name}'...")

    table = catalog.create_table(identifier=table_identifier, schema=schema)
    print(f"Table '{db_name}.{table_name}' created successfully")

    arrow_table = pa.Table.from_pandas(df)
    table.append(arrow_table)
    print("Data loaded to new table successfully")

# Data validation
print(f"Checking record count for '{db_name}.{table_name}' table:")

snapshot = table.current_snapshot()
if snapshot:
    record_count = int(snapshot.summary.get("total-records", 0))
else:
    record_count = 0
print(f"Total records: {record_count}")
Repeated loading was also performed on the Iceberg table for Materialized View testing.

External Catalog Configuration
Configure External Catalogs to access external data sources through StarRocks client tools (MySQL-compatible clients).
Supported Data Sources
StarRocks supports integration with various external data sources:
- Data Lake Formats: Apache Iceberg, Apache Hudi, Delta Lake
- Relational Databases: MySQL, PostgreSQL, Oracle, SQL Server, etc.
Apache Iceberg Catalog Creation
Creating catalogs for Data Lake formats requires interface configuration with metastores (Hive, Glue, REST Catalog, RDB, etc.).
-- Create Iceberg External Catalog
CREATE EXTERNAL CATALOG iceberg_catalog3
PROPERTIES (
    "type" = "iceberg",
    "iceberg.catalog.type" = "hive",
    "hive.metastore.uris" = "thrift://<hive-metastore>:<port>",
    "aws.s3.enable_path_style_access" = "true",  -- Required when using MinIO
    "aws.s3.endpoint" = "<your-endpoint>:<port>",
    "aws.s3.access_key" = "<your-s3-access-key>",
    "aws.s3.secret_key" = "<your-s3-secret-key>"
);
Catalog Validation and Testing
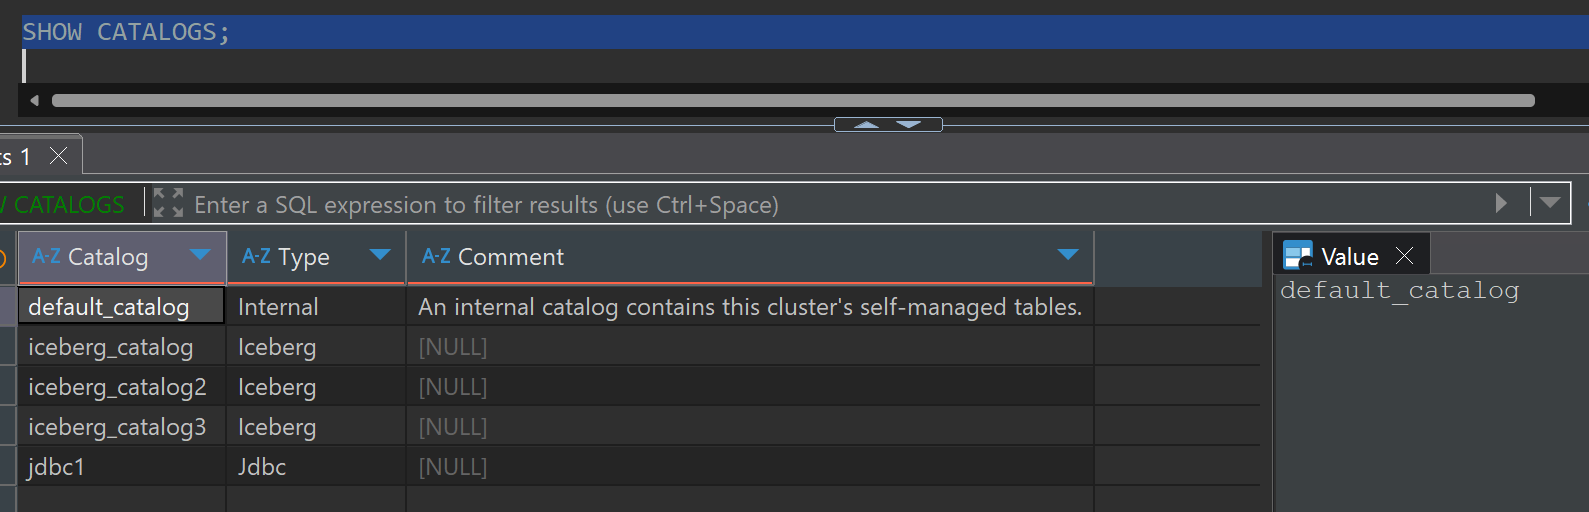
Verify Created Catalog List
SHOW CATALOGS;
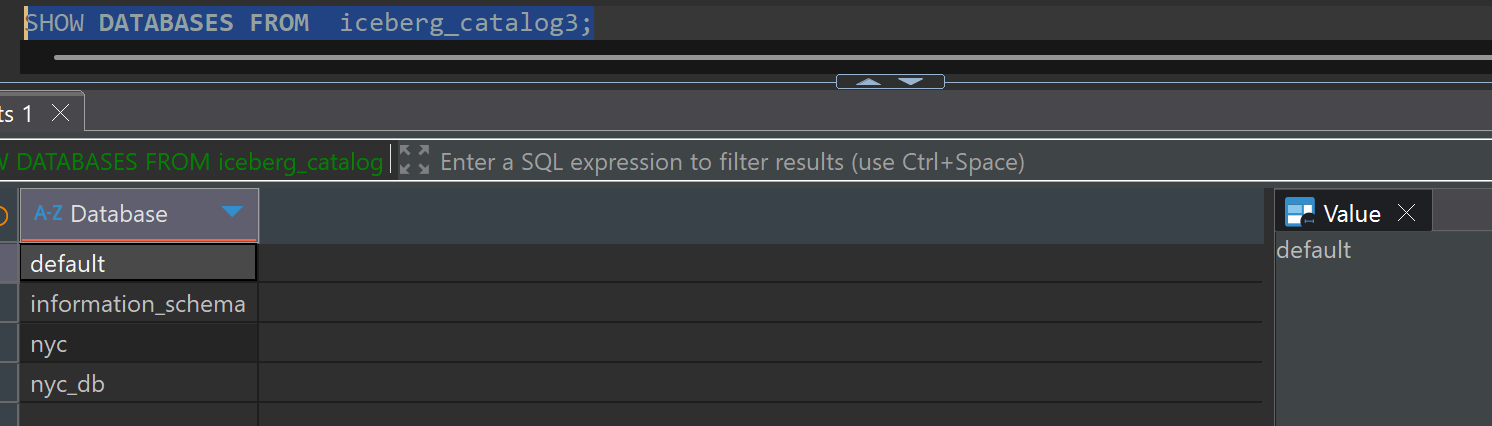
Query Databases in Catalog
SHOW DATABASES FROM iceberg_catalog3;
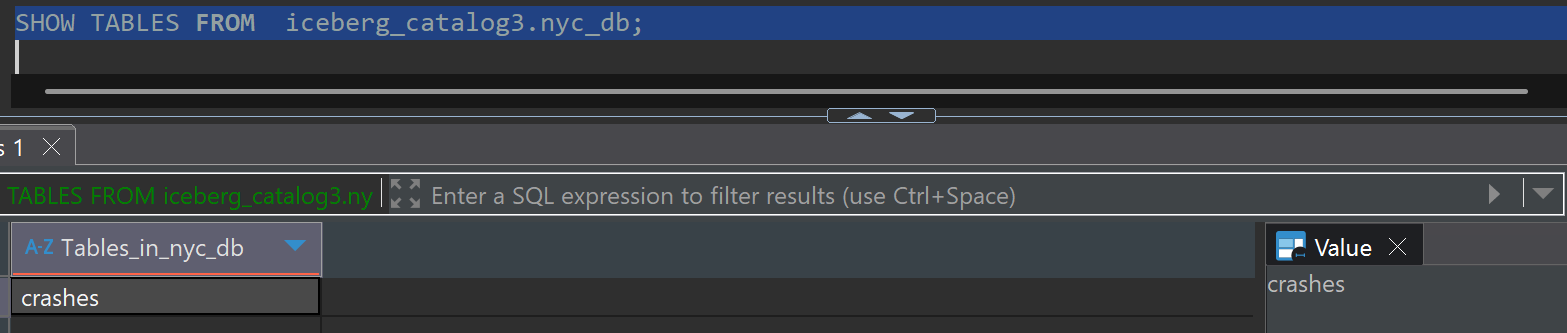
Check Table List
SHOW TABLES FROM iceberg_catalog3.nyc_db;
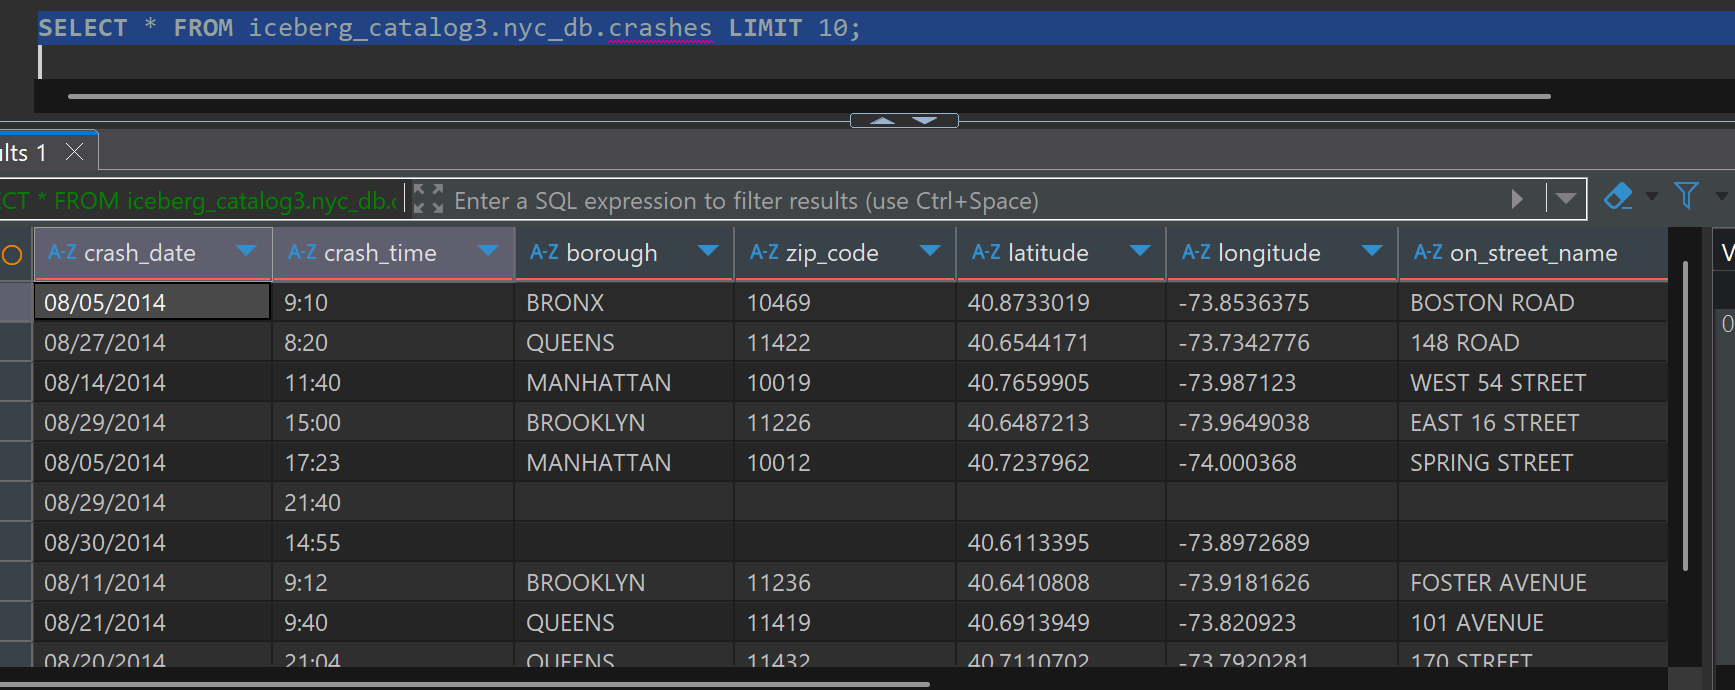
Query Sample Data
SELECT * FROM iceberg_catalog3.nyc_db.crashes LIMIT 10;
Materialized View Implementation
Materialized Views containing aggregate functions (SUM, AVG, COUNT, etc.) in StarRocks must be created in ASYNC mode.
Single Data Source Materialized View
Using StarRocks Internal Table as Source
Create an asynchronous Materialized View based on internal catalog data.
-- StarRocks Internal Table-based Materialized View
CREATE MATERIALIZED VIEW mv_crashdata
REFRESH ASYNC START("2024-01-01 00:00:00") EVERY(INTERVAL 10 MINUTE)
AS SELECT
    date_trunc('day', CRASH_DATE) AS Time,
    VEHICLE_TYPE_CODE_1,
    count(*) AS CNT
FROM quickstart.crashdata
GROUP BY Time, VEHICLE_TYPE_CODE_1;
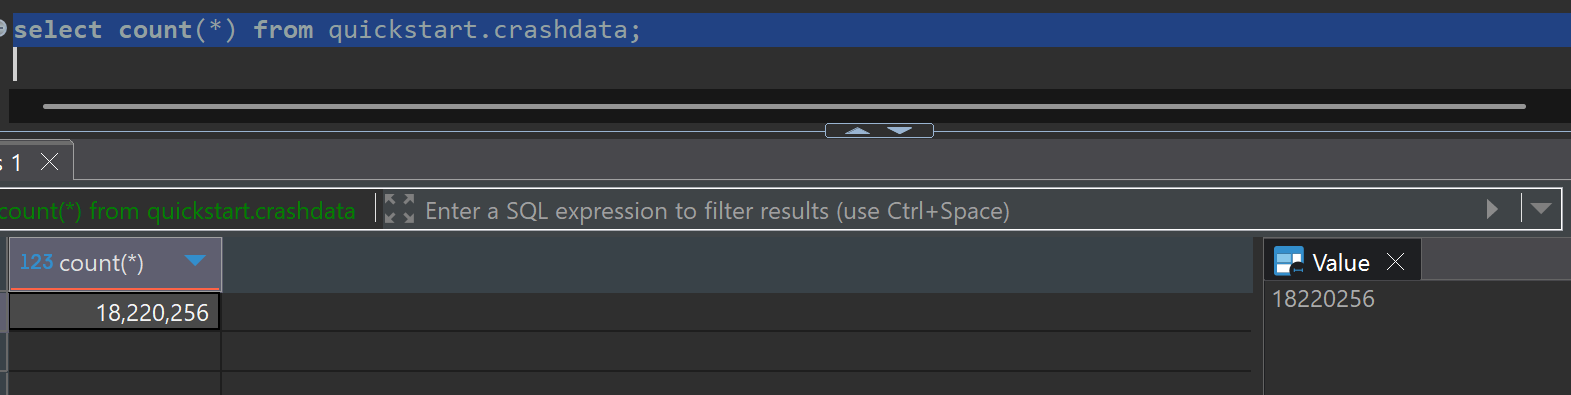
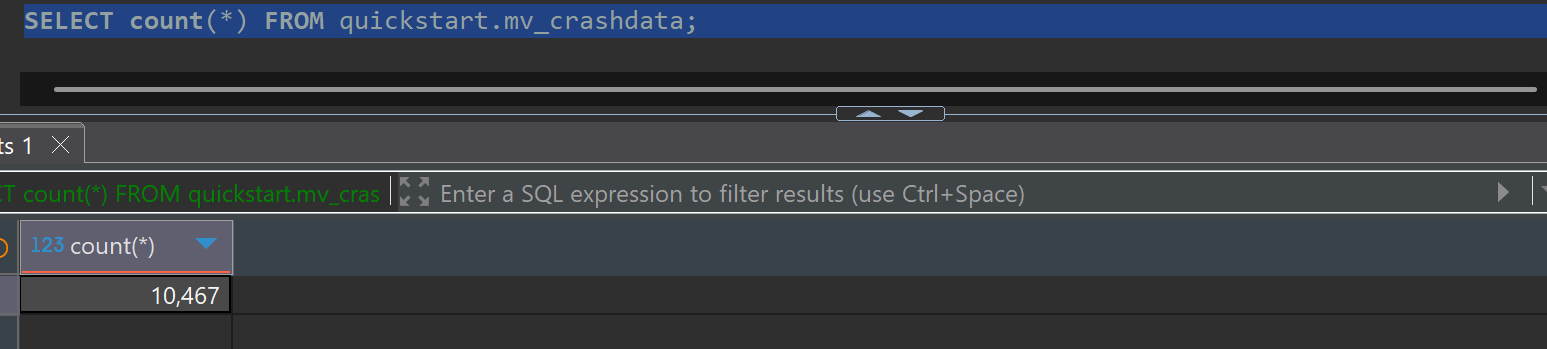
Data Aggregation Results Verification
Original data (quickstart.crashdata) of 18,220,556 records was aggregated to mv_crashdata with 10,467 records.
SELECT count(*) FROM quickstart.mv_crashdata;
Using Iceberg External Catalog as Source
Create an asynchronous Materialized View based on external catalog's Iceberg table.
-- Iceberg Table-based Materialized View
CREATE MATERIALIZED VIEW mv_iceberg_crashdata
REFRESH ASYNC START('2024-01-01 00:00:00') EVERY(INTERVAL 10 MINUTE)
AS
SELECT
    CAST(STR_TO_DATE(CRASH_DATE,'%m/%d/%Y') AS DATETIME) AS Time,
    VEHICLE_TYPE_CODE_1,
    COUNT(*) AS CNT
FROM iceberg_catalog3.nyc_db.crashes
GROUP BY Time, VEHICLE_TYPE_CODE_1;
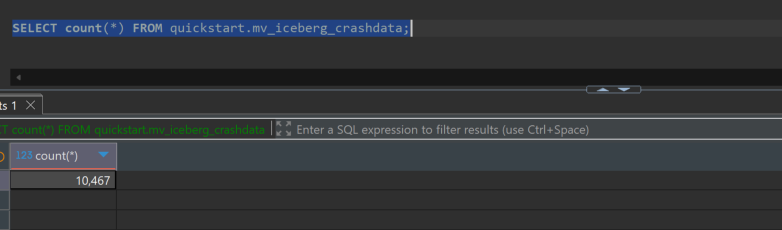
Data Aggregation Results Verification
Original data (iceberg_catalog3.nyc_db.crashes) of 9,745,657 records was aggregated to mv_iceberg_crashdata with 10,467 records.
SELECT count(*) FROM quickstart.mv_iceberg_crashdata;
Multi-Source Join Materialized View (Use Case Example)
One of StarRocks' powerful features is the ability to join data from different external catalogs to create integrated analysis views.
-- Multi-External Catalog Join Materialized View Example
CREATE MATERIALIZED VIEW unified_customer_analysis
REFRESH ASYNC START('2024-01-01 00:00:00') EVERY(INTERVAL 30 MINUTE)
AS SELECT
    c.customer_id,
    c.customer_name,
    c.region,
    o.order_count,
    o.total_spent,
    p.last_payment_date,
    p.payment_method
FROM mysql_catalog.crm_db.customers c
LEFT JOIN (
    SELECT
        customer_id,
        COUNT(*) as order_count,
        SUM(amount) as total_spent
    FROM iceberg_catalog.sales_db.orders
    WHERE order_date >= CURRENT_DATE - INTERVAL 90 DAY
    GROUP BY customer_id
) o ON c.customer_id = o.customer_id
LEFT JOIN (
    SELECT
        customer_id,
        MAX(payment_date) as last_payment_date,
        payment_method
    FROM postgres_catalog.payment_db.payments
    WHERE payment_date >= CURRENT_DATE - INTERVAL 30 DAY
    GROUP BY customer_id, payment_method
) p ON c.customer_id = p.customer_id;
Materialized View Operations Management
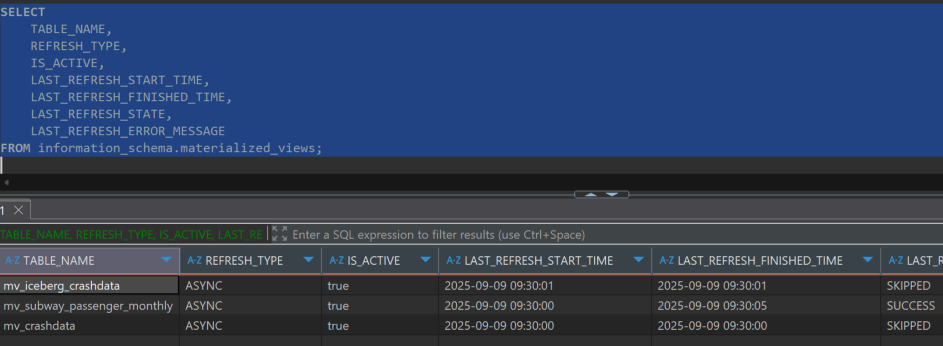
View Status Monitoring
Use information_schema.materialized_views to check status information of all Materialized Views.
-- Comprehensive Materialized View Status Query
SELECT
    TABLE_NAME,
    REFRESH_TYPE,
    IS_ACTIVE,
    LAST_REFRESH_START_TIME,
    LAST_REFRESH_FINISHED_TIME,
    LAST_REFRESH_STATE,
    LAST_REFRESH_ERROR_MESSAGE
FROM information_schema.materialized_views;
Manual Control and Management
Manual refresh and schedule management are possible through REFRESH and ALTER commands.
-- Execute manual refresh
REFRESH MATERIALIZED VIEW mv_iceberg_crashdata;

-- Pause/Resume Materialized View jobs
ALTER MATERIALIZED VIEW mv_iceberg_crashdata PAUSE;
ALTER MATERIALIZED VIEW mv_iceberg_crashdata RESUME;
Performance Optimization Strategy (Recommendations)
Using partitioning allows selective refresh of specific partitions instead of entire data, significantly improving performance.
-- Partition-based Materialized View Example
CREATE MATERIALIZED VIEW partitioned_sales_mv
PARTITION BY DATE_TRUNC('month', order_date)
REFRESH ASYNC START('2024-01-01 00:00:00') EVERY(INTERVAL 1 HOUR)
AS SELECT
    DATE_TRUNC('month', order_date) as month,
    product_category,
    SUM(sales_amount) as total_sales,
    COUNT(*) as order_count
FROM sales_data
GROUP BY DATE_TRUNC('month', order_date), product_category;
Apache Superset Integration and Data Visualization
Integrate the four types of data sources implemented with Apache Superset to create visualization dashboards and perform comparative analysis of query performance and data consistency.
Visualization Data Source Comparison
- Chart 1: StarRocks Original Table (quickstart.crashdata)
- Chart 2: StarRocks Materialized View (quickstart.mv_crashdata)
- Chart 3: Iceberg Original Table (iceberg_catalog3.nyc_db.crashes)
- Chart 4: Iceberg-based Materialized View (quickstart.mv_iceberg_crashdata)
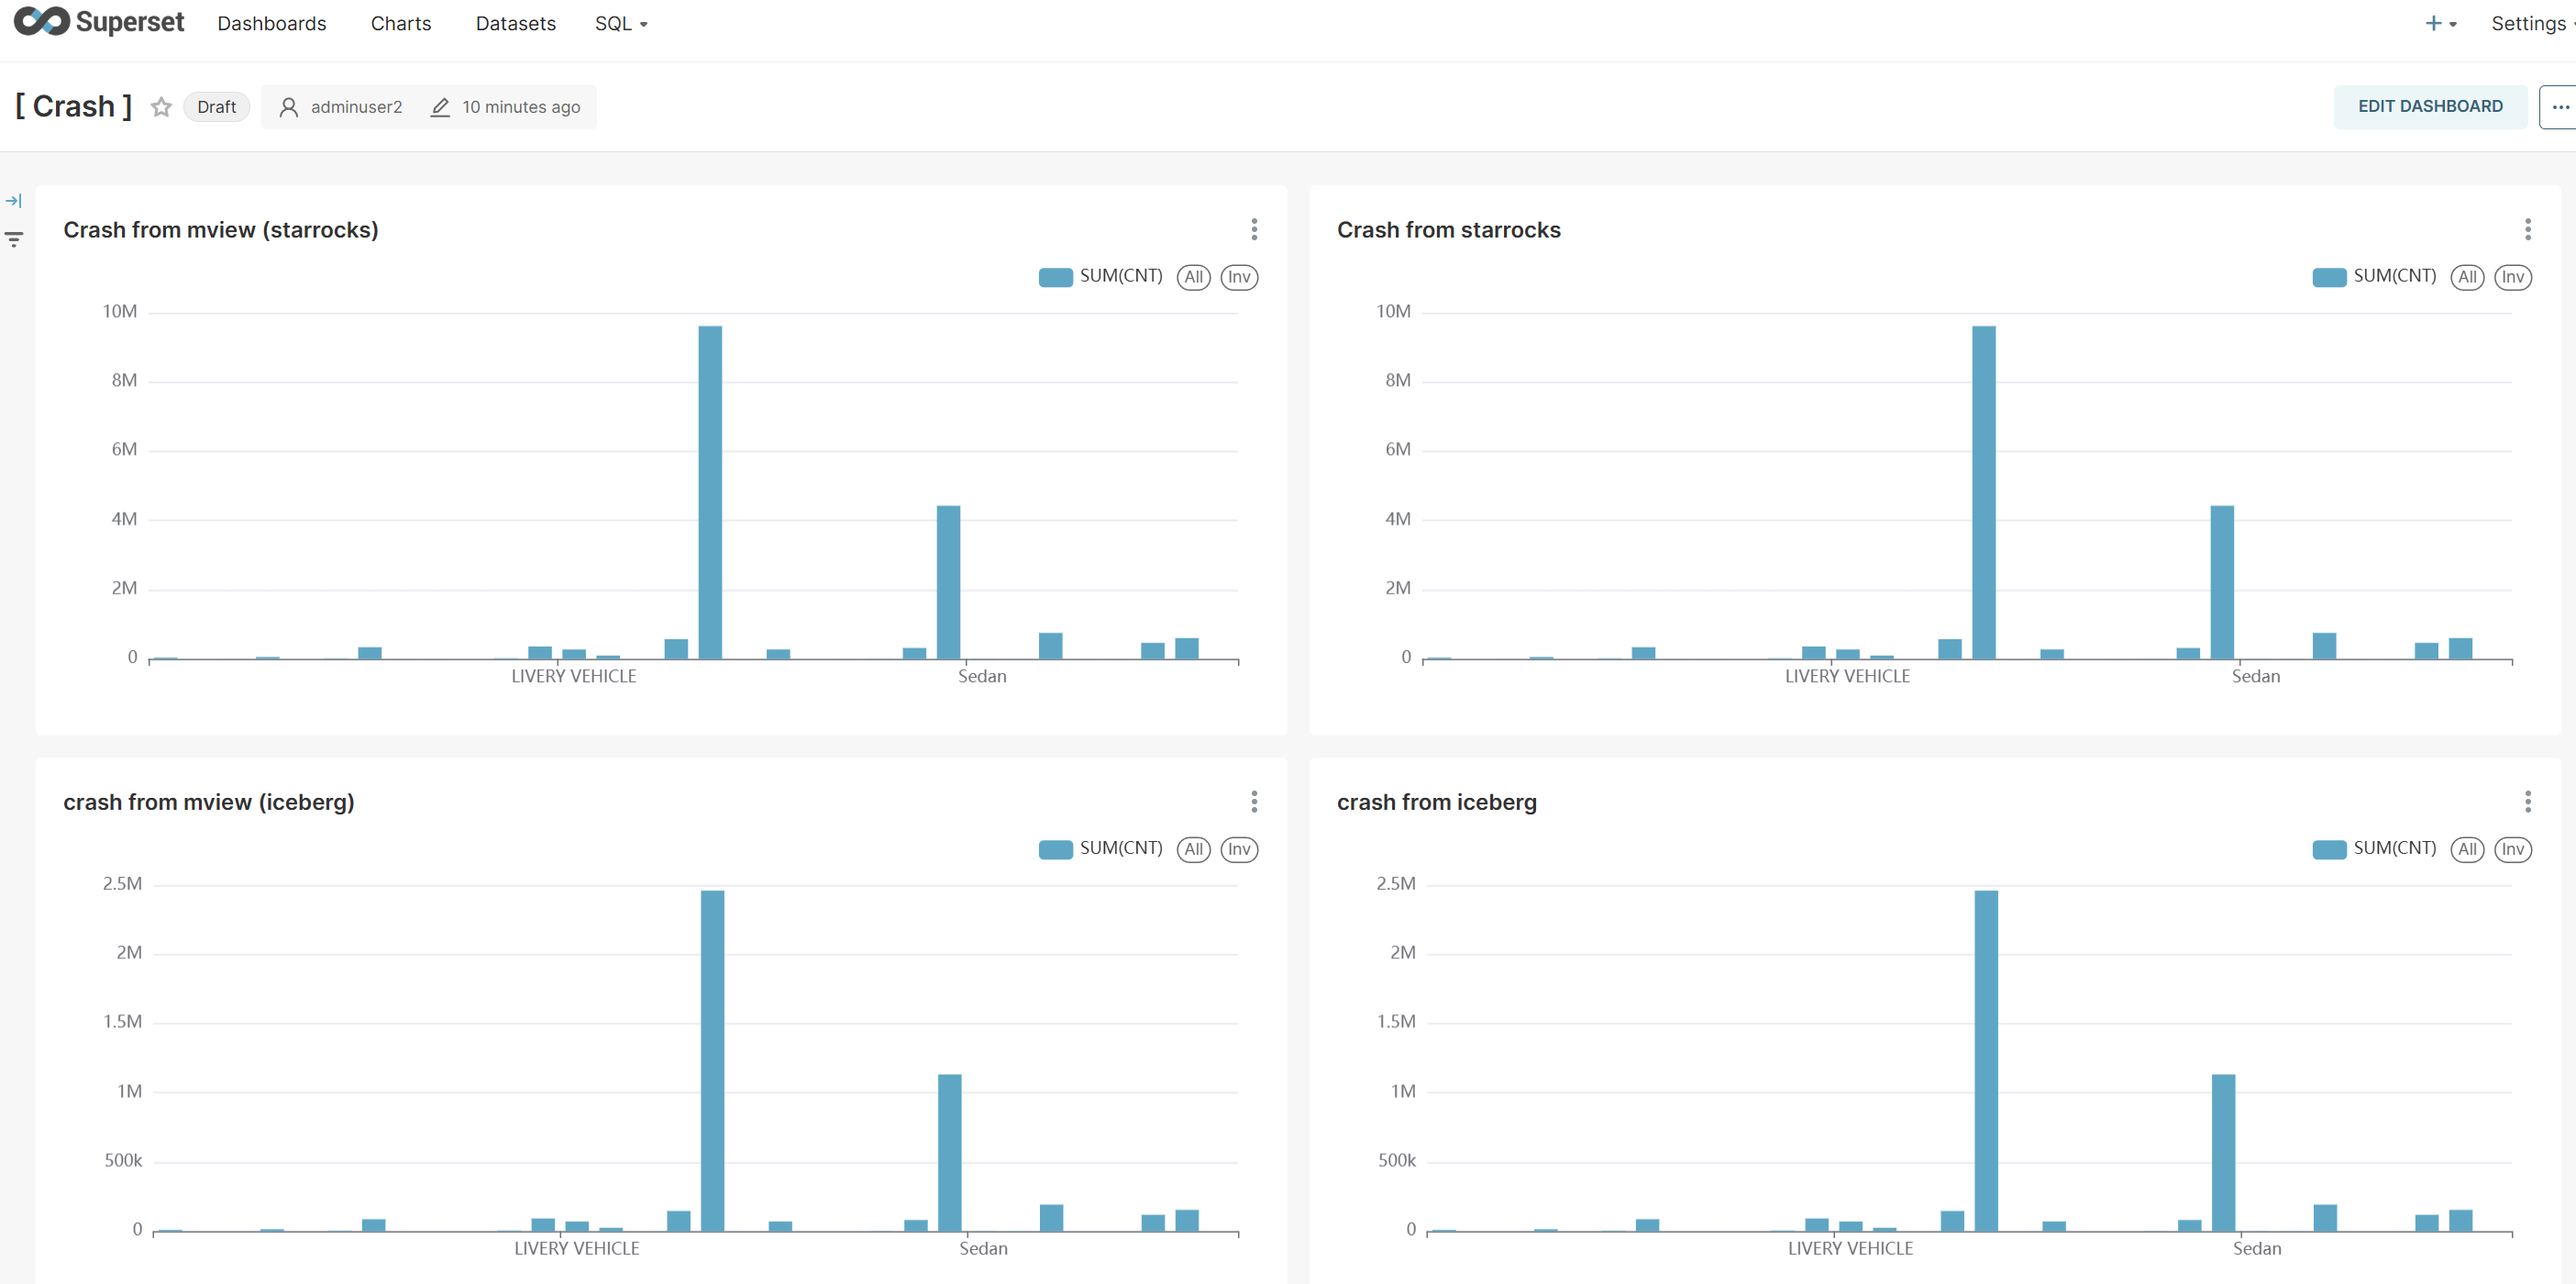
Performance Analysis Results
This visualization provides the following insights:
- Query Response Speed: Materialized Views show significantly faster response times compared to original tables
- Data Consistency: All charts confirm identical trends and patterns
- Resource Efficiency: Computing resource savings through pre-aggregated data
Conclusion and Future Directions
Key Achievements
StarRocks' No-ETL architecture using Materialized Views provides clear value through:
- Real-time Data Integration: Real-time integrated analysis of various source data without complex ETL pipelines
- Operational Cost Optimization: Significant reduction in ETL infrastructure construction and maintenance costs with minimized operational complexity
- Scalability and Flexibility: Quick expansion through simple SQL-based configuration when adding new data sources
- Excellent Performance: Sub-second query response times through pre-calculated Materialized Views
- Development Productivity: Intuitive data transformation and analysis logic implementation based on SQL
Future Development Directions
- Streaming Data Integration: Extended integration with real-time streaming data such as Apache Kafka
- Machine Learning Pipeline Integration: Natural integration with MLOps workflows
- Advanced Analytics Features: Application to sophisticated analysis cases such as time series analysis and anomaly detection
- Multi-cloud Strategy: Hybrid data architecture configuration across various cloud environments
Through this guide, master StarRocks' powerful Materialized View functionality and establish the foundation for next-generation data analytics environment construction.