
Creating Custom Map Charts in Apache Superset
This guide provides a step-by-step approach to visualizing custom maps in Apache Superset using GIS data.
Overview
This guide provides step-by-step instructions for creating custom map charts in Apache Superset using GIS data. Using Bucheon City's legal dong SHP files as an example, we'll cover the process of map visualization through Deck.gl Polygon charts.
Table of Contents
- Generate Mapbox API Key
- Create Superset Catalog
- Convert SHP Files to GeoJSON
- Load PostgreSQL Geometry Data
- Create Superset Deck.gl Polygon Chart
1. Generate Mapbox API Key
Superset's Deck.gl charts render maps based on Mapbox, so an API key is essential.
Create Mapbox Account
- Create an account at Mapbox website
- Free usage is provided, but credit card information is required during account creation
Generate API Key
- Navigate to Access Tokens section in the account dashboard
- Click Create a token to generate a public token (starting with
pk.*) - Copy the generated key(example):
pk.eyJ1IjoieW91cnVzZXJuYW1lIiwiYSI6ImNrd2V3ZjF0ZTAxMzIycW1wZ3Z3M2Z3c3MifQ.abc123
Note: Free keys have usage limitations, so consider paid plans for production environments.
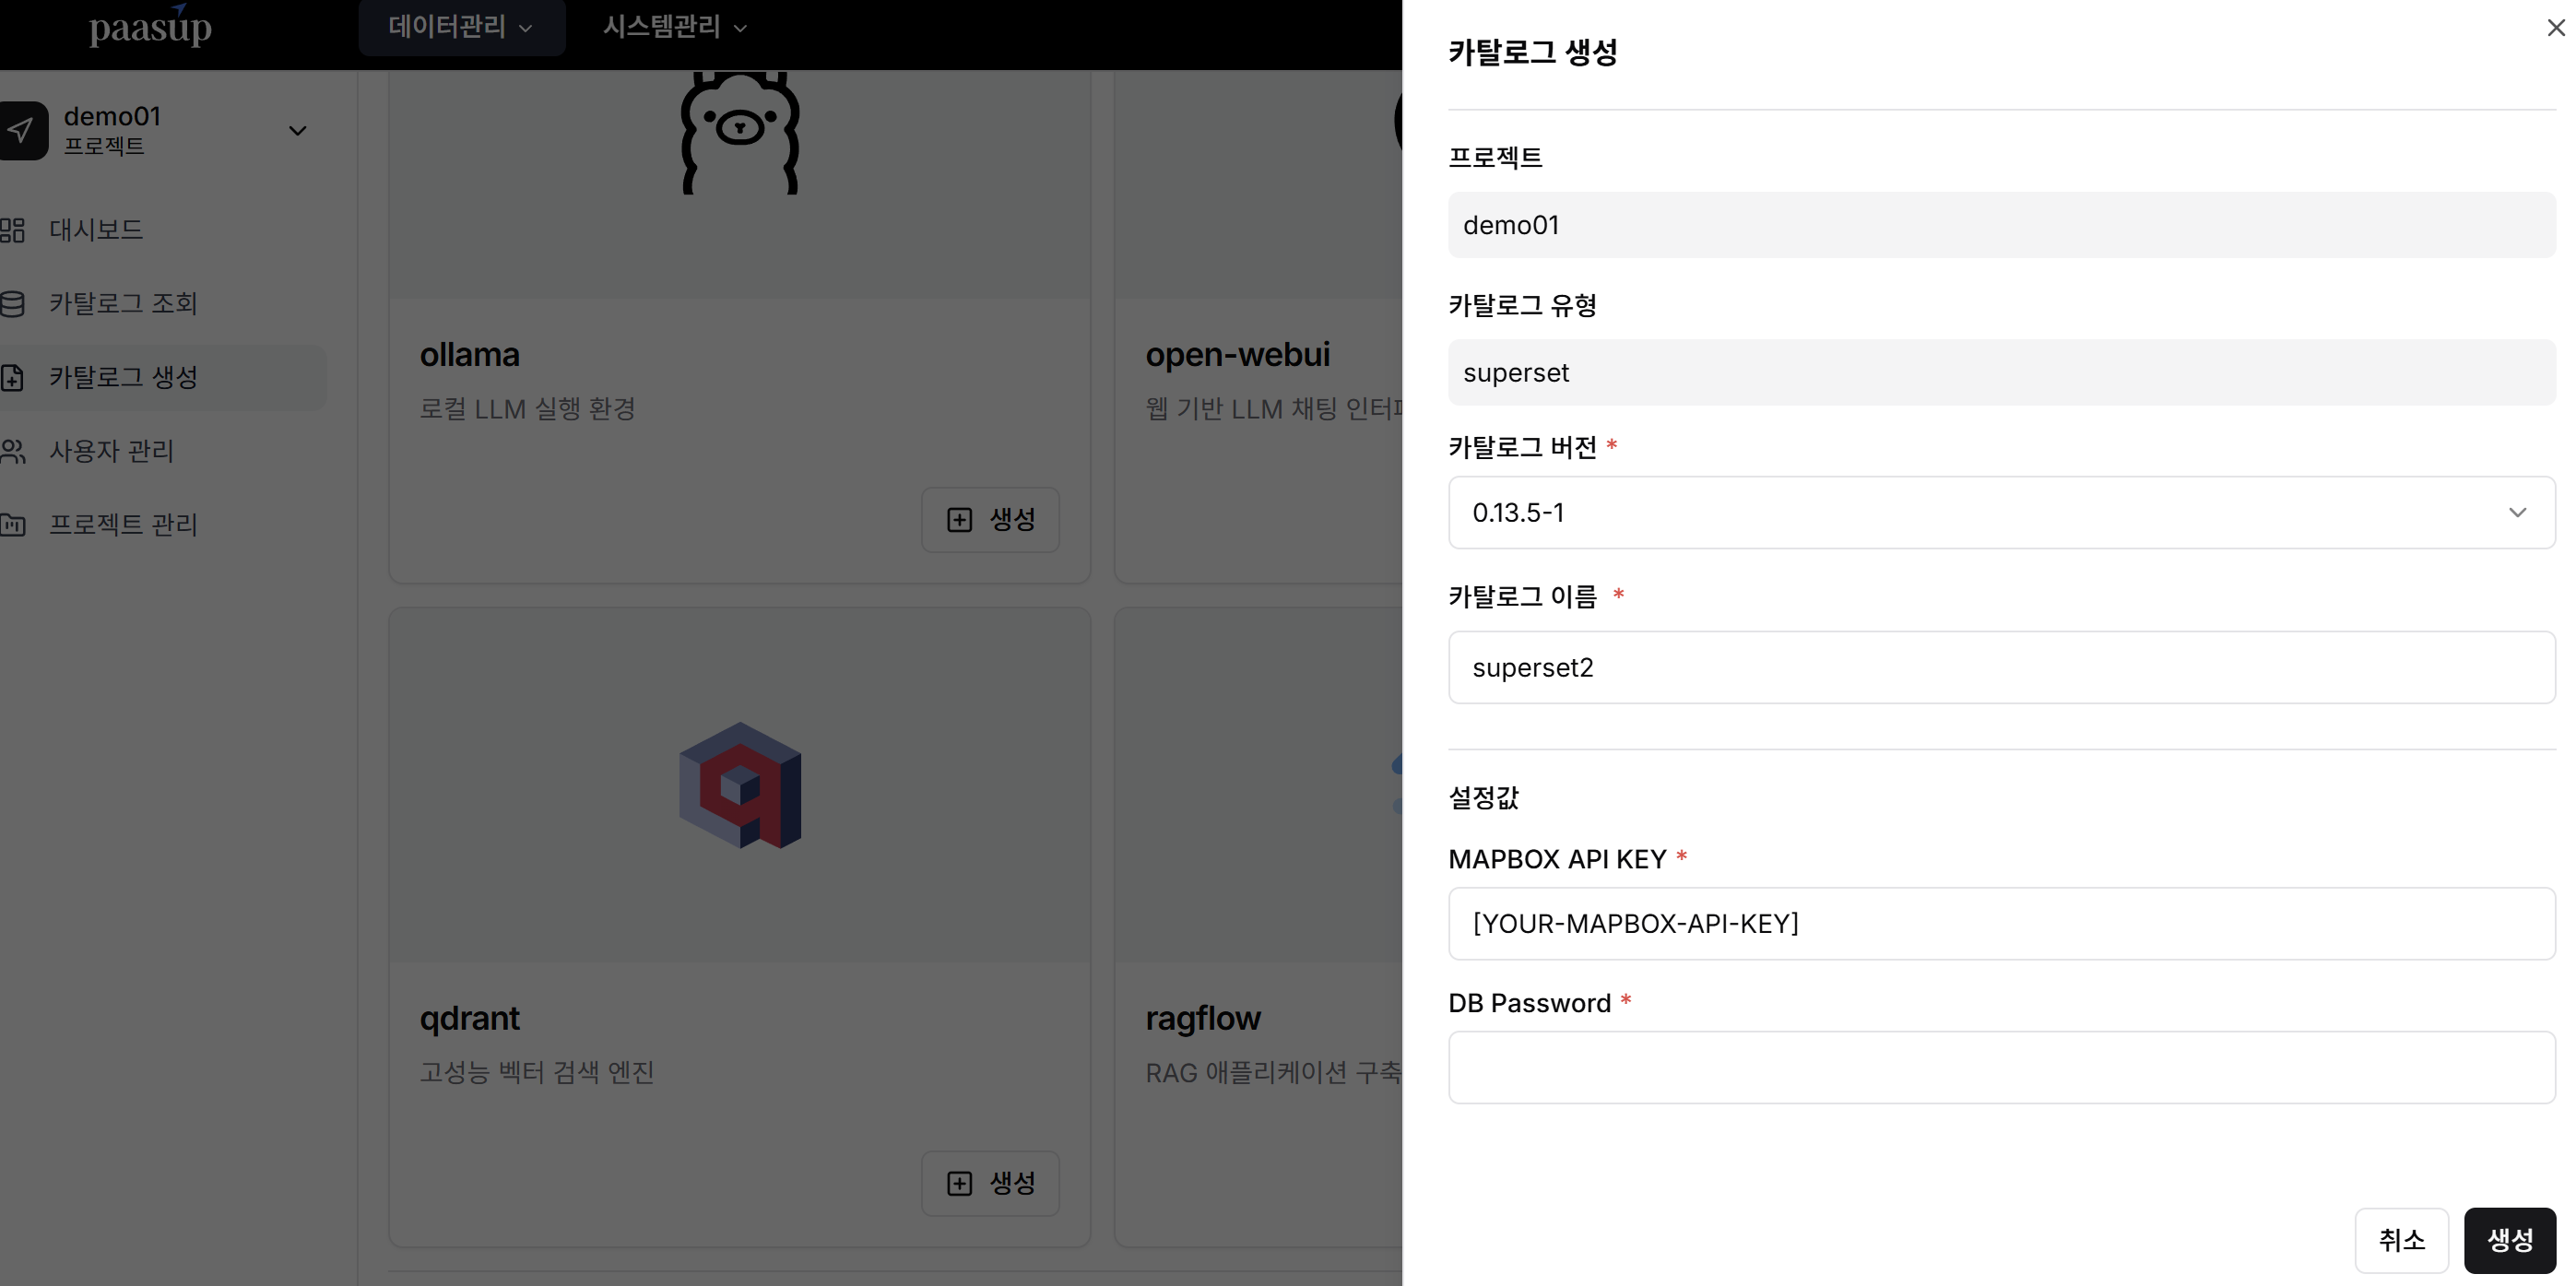
2. Create Superset Catalog
When creating a Superset catalog in the PaasUp DIP Portal, enter the MapBox API_KEY to deploy the catalog.
3. Convert SHP Files to GeoJSON
Convert SHP (Shapefile) format from public data portals to GeoJSON format usable in Superset, and adjust the coordinate system to EPSG:4326 (WGS84).
3.1. Conversion Methods
Using Python geopandas
Install libraries:
pip install geopandas fiona shapely
Conversion code:
import geopandas as gpd

# Load SHP file
gdf = gpd.read_file('BADM.shp')

# Save as GeoJSON
gdf.to_file('BADM.geojson', driver='GeoJSON')
print("GeoJSON conversion completed")
Using GDAL ogr2ogr
Install GDAL:
- Ubuntu/Debian:
sudo apt-get install gdal-bin - macOS:
brew install gdal - Windows: Install OSGeo4W or GDAL binaries
Conversion command:
ogr2ogr -f GeoJSON BADM.geojson BADM.shp
3.2. Coordinate System Transformation
Transform the SHP file's coordinate system (EPSG:5186) to EPSG:4326 (WGS84).
geopandas Method
import geopandas as gpd

# Load SHP file and check coordinate system
gdf = gpd.read_file('BADM.shp')
print(gdf.crs)  # Example: EPSG:5186

# Transform coordinate system
gdf = gdf.to_crs(epsg=4326)

# Save transformed GeoJSON
gdf.to_file('BADM_converted.geojson', driver='GeoJSON')
print("Coordinate system transformation and GeoJSON saving completed")
ogr2ogr Method
ogr2ogr -f GeoJSON -s_srs EPSG:5186 -t_srs EPSG:4326 BADM_converted.geojson BADM.shp
Verify Conversion Results
- Upload the file to GeoJSON.io to verify map display
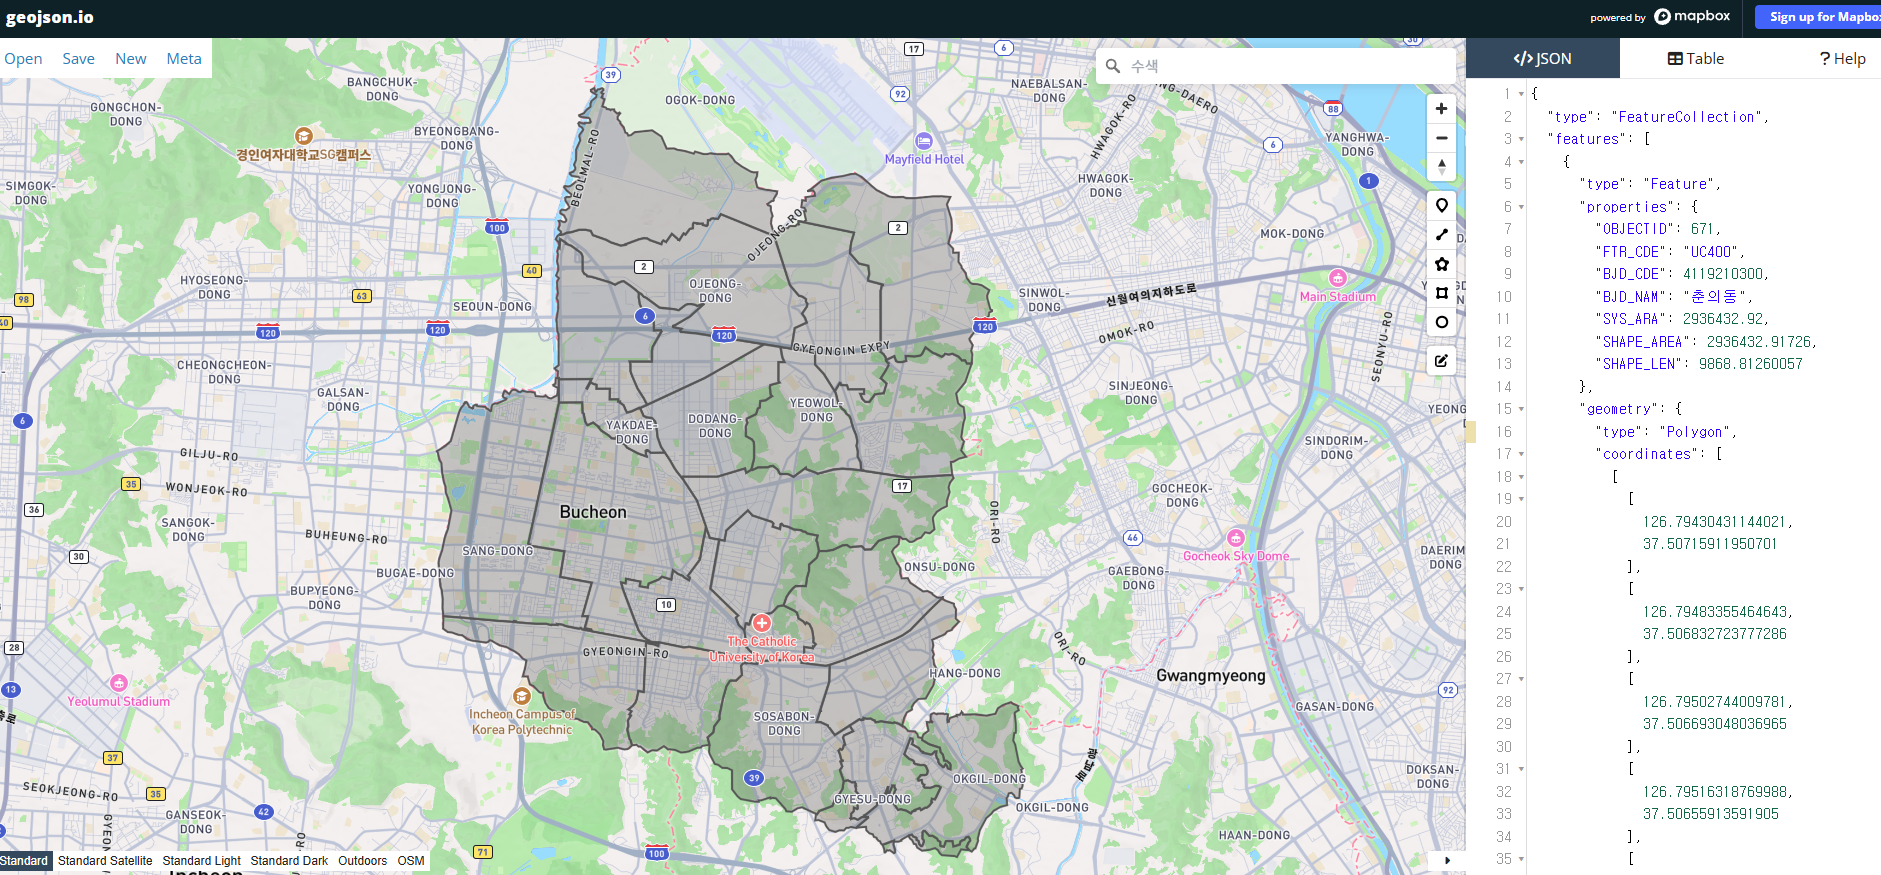
- Verify coordinate system: Check that
gdf.crsoutput isEPSG:4326
4. Load PostgreSQL Geometry Data
Load the converted GeoJSON data into PostgreSQL/PostGIS so it can be queried in Superset.
4.1. Table Creation
Enable PostGIS extension:
CREATE EXTENSION postgis;
Create table:
CREATE TABLE BADM (
    OBJECT_ID varchar(10),
    BJD_NAM varchar(100),  -- Legal dong name
    geom GEOMETRY(Geometry, 4326)  -- WGS84 coordinate system
);
4.2. Data Loading
Python Method
import geopandas as gpd
from sqlalchemy import create_engine

# Load GeoJSON
gdf = gpd.read_file('BADM_converted.geojson')

# PostgreSQL connection
engine = create_engine('postgresql://username:password@localhost:5432/database_name')

# Load data
gdf.to_postgis('BADM', engine, if_exists='replace', index=False)
print("Data loading completed")
OGR2OGR Method
ogr2ogr -f "PostgreSQL" PG:"dbname=database_name user=username password=password" BADM_converted.geojson -nln BADM -nlt GEOMETRY -lco GEOMETRY_NAME=geom -lco SRID=4326
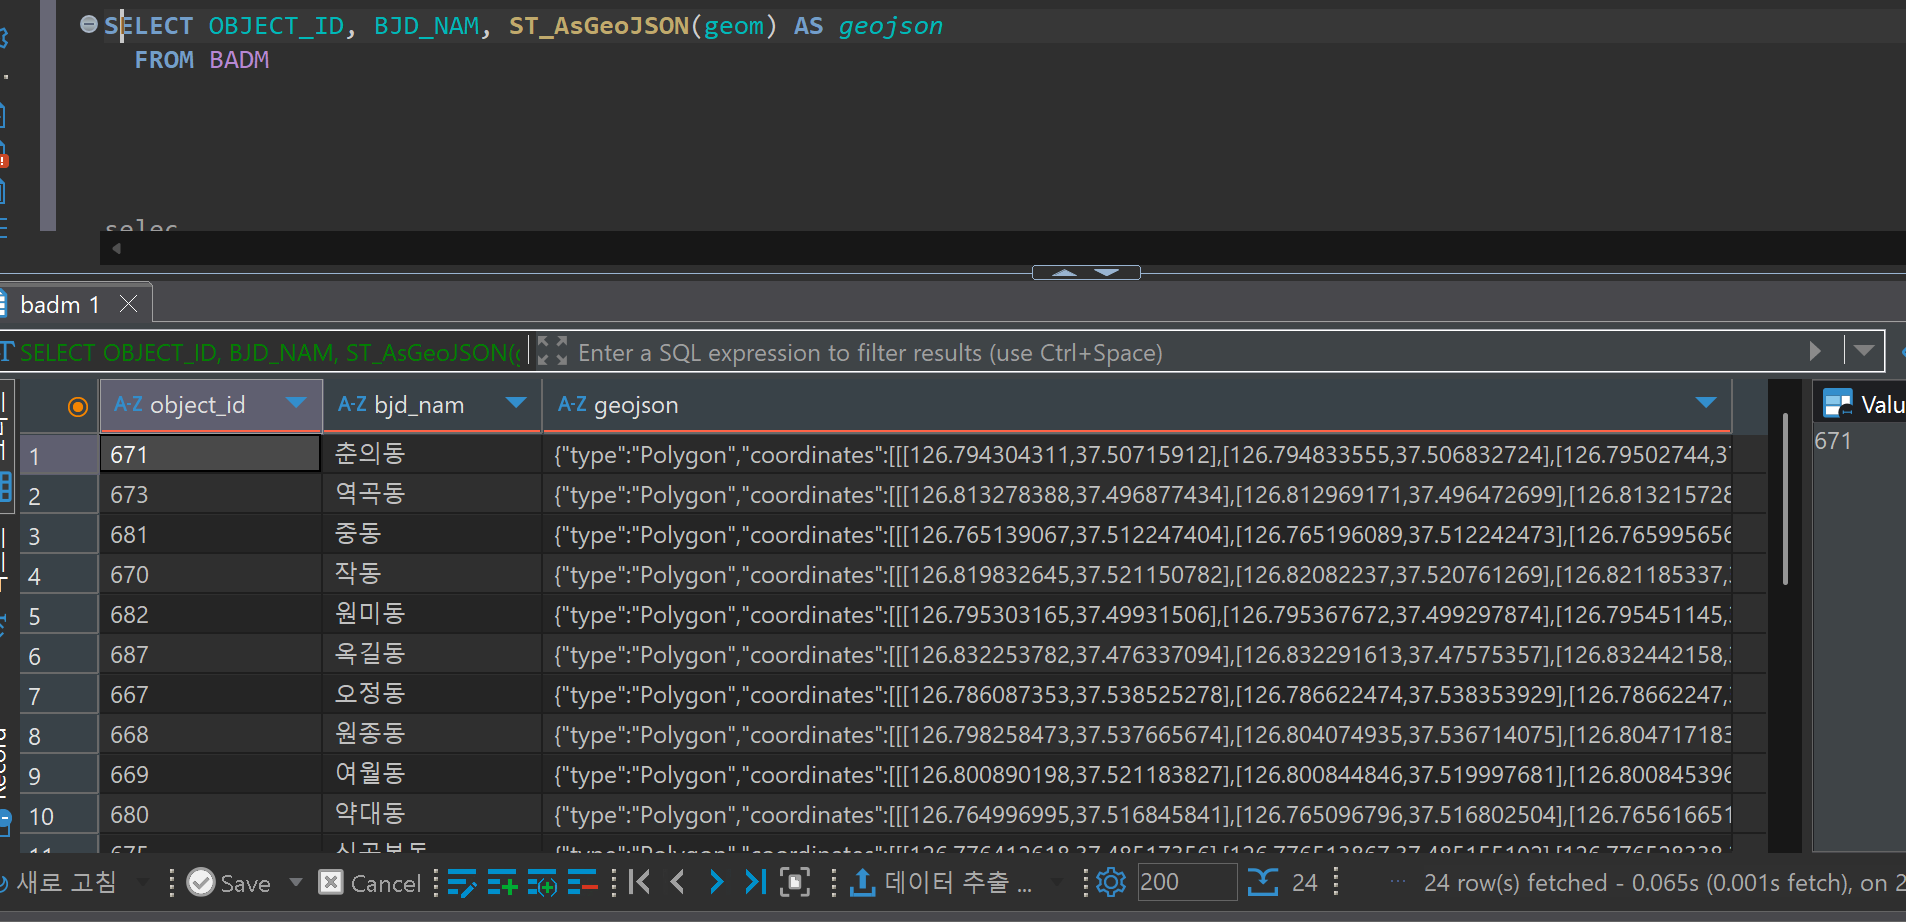
Verify Loading
SELECT OBJECT_ID, BJD_NAM, ST_AsGeoJSON(geom) AS geojson
FROM BADM
LIMIT 10;
Performance Optimization
CREATE INDEX idx_badm_geom ON BADM USING GIST(geom);
5. Create Superset Deck.gl Polygon Chart
Create a Deck.gl Polygon chart using PostgreSQL data.
Chart Creation Steps
1. Write Query in SQL Lab
Write a query that outputs Polygon data in the following format:
- Polygon:
[[longitude1, latitude1], [longitude2, latitude2], ..., [longitudeN, latitudeN]] - MultiPolygon:
[[[longitude11, latitude11], ...], [[longitude21, latitude21], ...]]
Query example:
SELECT
    (ST_AsGeoJSON(geom)::jsonb -> 'coordinates' -> 0) #>> '{}' AS border,
    ROUND((ST_Area(ST_Transform(geom, 32652)) / 1000000)::numeric, 2) AS area_km2,
    BJD_NAM
FROM BADM;
2. Add Dataset
- Create a new dataset using the written SQL
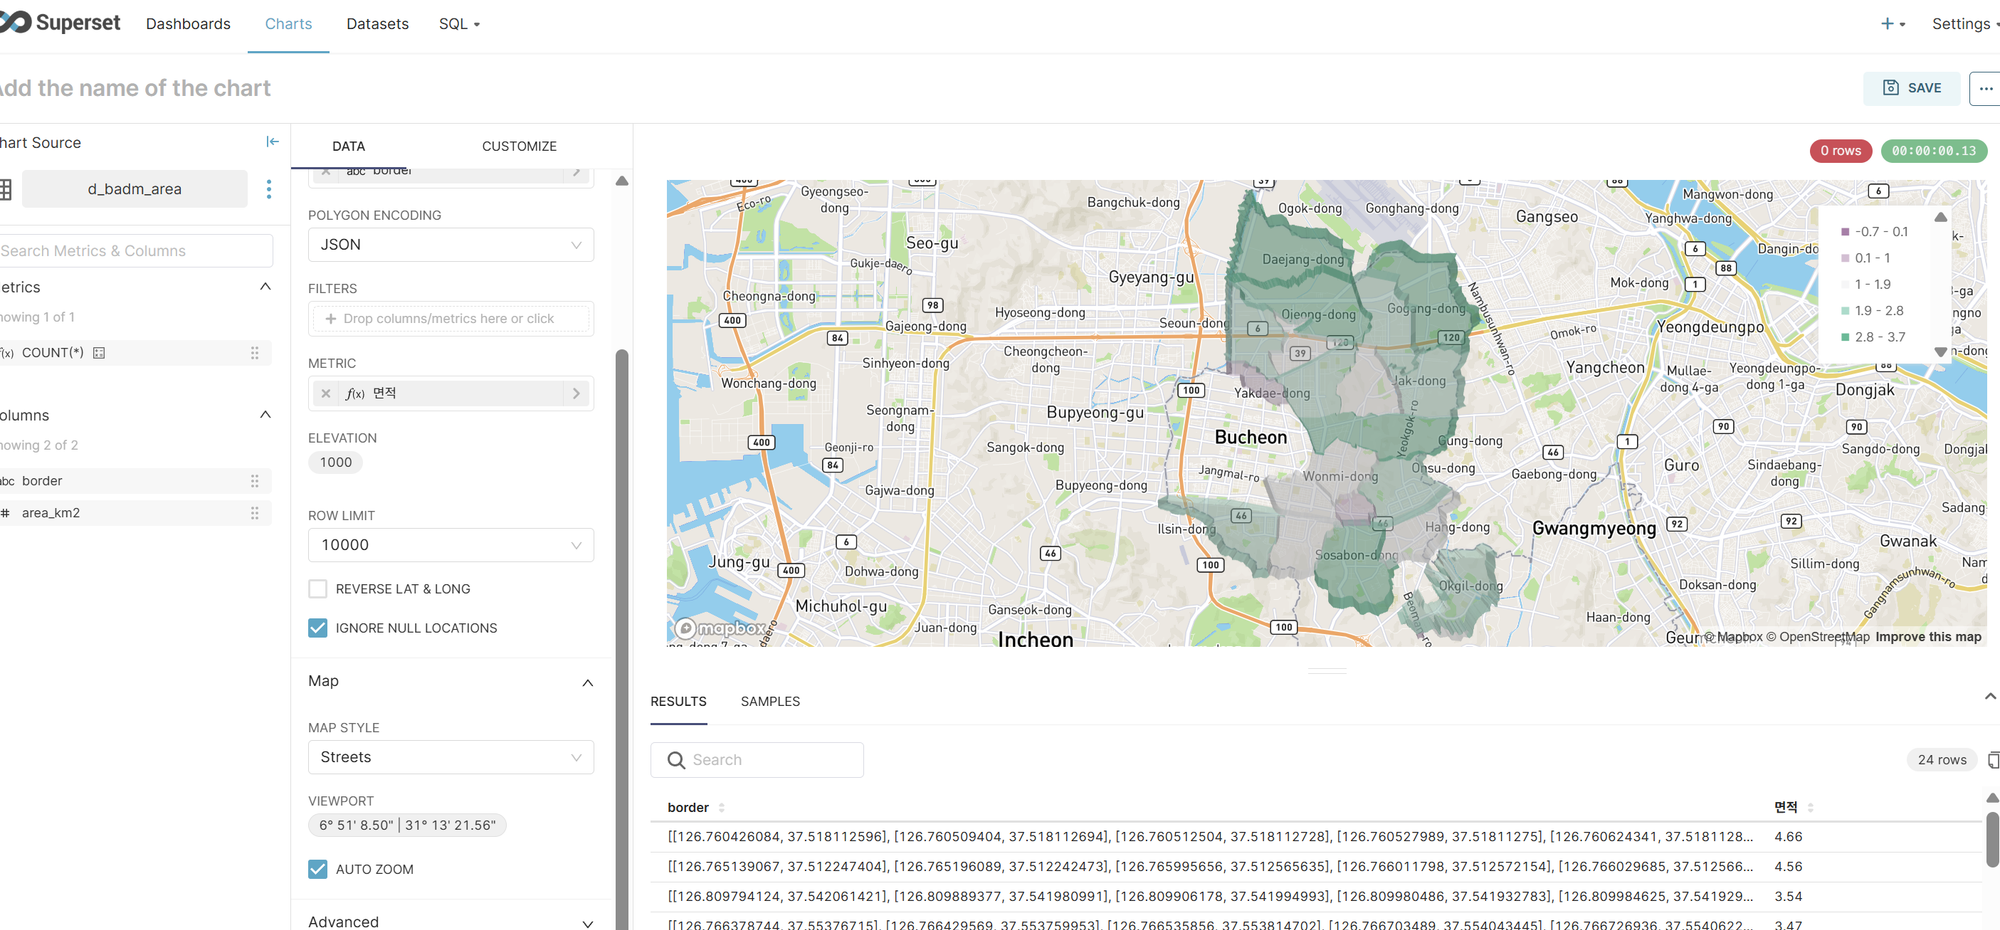
3. Chart Configuration
- Select Deck.gl Polygon in Charts > Create a new chart
- Polygon Column: Select
border - Metric: Set area (
area_km2) orCOUNT(*) - Map Style: Select
Streets
Conclusion
Through this guide, you can create custom map charts using GIS data in Superset.
Considerations
- Mapbox switches to paid service when free usage is exceeded
- Place names are displayed in English
- Future consideration needed for integrating free map services like OpenStreetMap