A test plan for quantitatively measuring the DIP platform's batch ELT, real-time CDC, and analytical query performance using the TPC-DS standard benchmark. It compares and validates Spark, StarRocks, OLake, and Kafka CDC pipelines.
This plan quantitatively measures the data processing performance of the DIP platform using the TPC-DS standard benchmark. Tests are divided into three areas — batch loading, real-time CDC, and analytical queries — with the following key metrics defined for each.
Test Area
Measurement Target
DIP Components
ELT — Batch
Bulk data loading throughput
Spark → Iceberg → StarRocks (External Catalog)
ELT — Real-time (CDC)
Change data propagation latency and initial load throughput
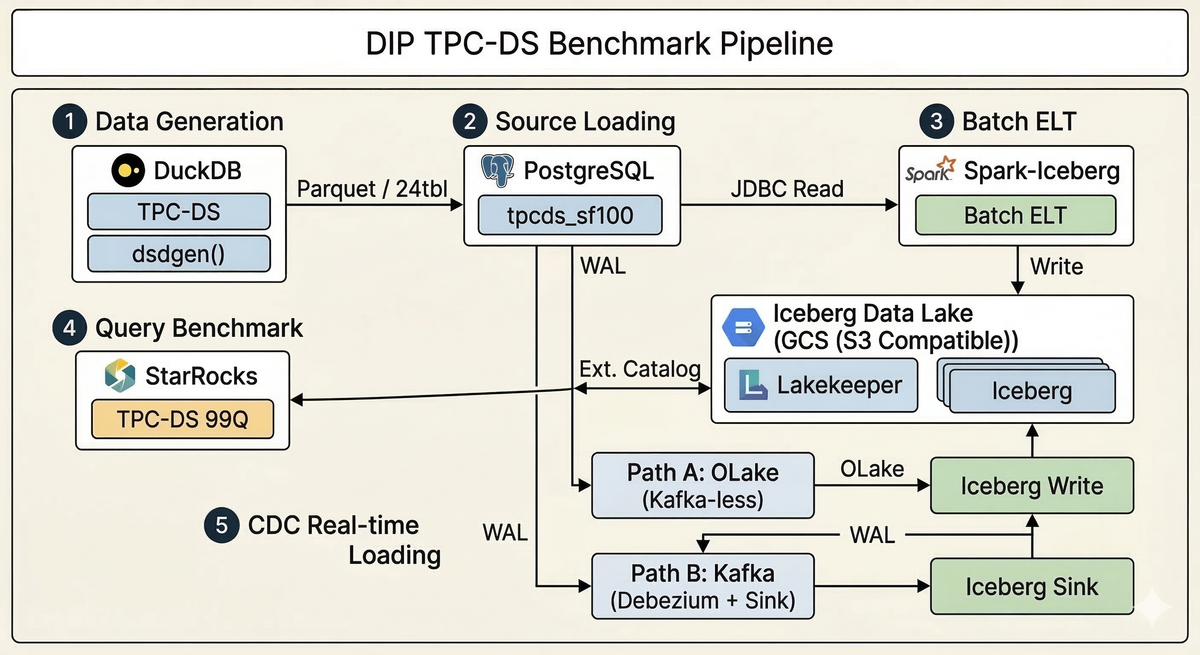
The diagram below illustrates the data flow across the entire benchmark pipeline. TPC-DS data generated by DuckDB is loaded into PostgreSQL, then written to Iceberg via batch (Spark) and real-time (OLake/Kafka) paths. Analytical queries are executed through the StarRocks External Catalog.
Create schema and load data into PostgreSQL (DuckDB postgres extension)
Execute Spark job — start timing
Verify load completion and validate source-target row counts
Stop timing, collect resource metrics
3.2 ELT Performance — Real-time CDC
Objective: Measure end-to-end latency for real-time change propagation from the source DB, and compare initial load throughput between the two CDC paths (OLake vs Kafka).
Incremental load increase until maximum throughput is reached
A, B
600K rows
R-09
Schema Evolution
Verify CDC continues to function correctly after column addition
A, B
—
R-10
Recovery Test
Validate data consistency after CDC process failure and recovery
A, B
—
R-11
Large Transaction
Process 100K changes within a single transaction
A, B
100K rows
3.2.4 Latency Measurement Method
A timestamp column (_benchmark_ts) is added to the source table, and latency is calculated as the difference between the source timestamp and the Iceberg reflection time.
-- PostgreSQL source: INSERT with timestamp
INSERT INTO store_sales_cdc (ss_sold_date_sk, ..., _benchmark_ts)
VALUES (..., clock_timestamp());

-- Iceberg target: Check reflection time (Spark SQL)
SELECT _benchmark_ts,
       current_timestamp() AS received_ts,
       (unix_timestamp(current_timestamp()) - unix_timestamp(_benchmark_ts)) * 1000 AS latency_ms
FROM lakekeeper.<namespace>.store_sales_cdc
WHERE _benchmark_ts > '2026-03-10 10:00:00';
Path A (OLake): The Iceberg namespace is automatically created by the OLake job configuration. Path B (Kafka): The Iceberg namespace is determined by the Sink connector's dynamic routing (e.g., debezium_tpcds_sf1).
⚠️ Note: NTP time synchronization between source and target systems is essential for accurate latency measurement. Measuring from the same server is recommended whenever possible.
3.2.5 Execution Steps
Path A (OLake):
Register source in OLake UI — PostgreSQL, tpcds_sf1
Query count: 99 TPC-DS queries (converted to StarRocks-compatible syntax)
Data: Iceberg tables loaded via Batch ELT or CDC
3.3.2 Query Classification
Category
Example TPC-DS Queries
Characteristics
Simple Scan/Filter
Q3, Q7, Q19, Q42, Q52, Q55
Single fact table, simple joins
Multi-way Join
Q13, Q17, Q25, Q29, Q34
Joins across 3+ tables
Aggregation/Grouping
Q1, Q6, Q11, Q27, Q46
GROUP BY, HAVING, window functions
Subquery/CTE
Q4, Q14, Q23, Q31, Q39
Complex subqueries, WITH clauses
Large-scale Join
Q64, Q72, Q78, Q80, Q82
Joins between large fact tables
3.3.3 Metrics
Metric
Unit
Description
Query Response Time
seconds (s)
Execution time per query
Geometric Mean
seconds (s)
TPC-DS standard geometric mean performance metric
Cold / Warm Run
seconds (s)
Without cache (Cold) vs with cache (Warm)
Throughput
queries/hr
Queries processed per hour (Power + Throughput test)
Concurrency
—
Performance impact as concurrent users increase
Query Profile
—
Execution plan, rows scanned, memory usage
3.3.4 Test Cases
ID
Test Name
Description
SF
Q-01
Power Test (Cold Run)
Sequential execution of 99 queries, 1st run after cache flush
100
Q-02
Warm Run
Sequential execution of 99 queries, 2nd run (cache utilized)
100
Q-03
Category Drill-down
Detailed profiling of representative queries per category
100
Q-04
Concurrency — 2 users
Query execution with 2 concurrent sessions
100
Q-05
Concurrency — 4 users
Query execution with 4 concurrent sessions
100
Q-06
Concurrency — 8 users
Query execution with 8 concurrent sessions
100
Q-07
Mixed Workload
Measure impact of concurrent batch loading during query execution
100
Q-08
Top-10 Slowest
Before/after comparison of tuning the 10 slowest queries
100
3.3.5 Execution Steps
Extract standard queries with DuckDB tpcds_queries() → Convert to StarRocks syntax
Validate StarRocks compatibility and fix incompatible queries
Flush cache (for Cold Run)
Execute queries sequentially and measure individual execution times
Collect query profiles (EXPLAIN ANALYZE)
Calculate Geometric Mean
4. TPC-DS Data Generation and Loading
4.1 Data Generation
TPC-DS data is generated using the DuckDB TPC-DS extension (dsdgen) and exported in Parquet format with ZSTD compression.
# Generate TPC-DS data (SF-1)
python benchmark/data/generate_tpcds.py 1

# Generate TPC-DS data (SF-100)
python benchmark/data/generate_tpcds.py 100
4.2 PostgreSQL Loading
Parquet files are loaded into PostgreSQL at high speed using the DuckDB postgres extension. The script is idempotent, safely replacing existing data on repeated runs.
# Load into PostgreSQL (idempotent)
python benchmark/data/load_to_postgres.py 1
4.3 StarRocks External Catalog Setup
StarRocks queries Iceberg tables directly through an External Catalog without additional data loading.
TPC-DS standard query extraction and StarRocks syntax conversion
Batch ELT
Spark + Lakekeeper
JDBC Read → Iceberg Write
CDC (Path A)
OLake
Direct PostgreSQL → Iceberg loading
CDC (Path B)
Debezium + Kafka + Iceberg Sink
Kafka-based CDC pipeline
CDC load generation
Python scripts / pgbench
INSERT / UPDATE / DELETE workloads
Query benchmark
Python + pymysql
Automated StarRocks query execution and timing
Kafka monitoring
Kafka UI (Provectus)
Consumer Lag, Topic, and Connector status monitoring
Resource collection
sar, iostat, vmstat
OS-level CPU / Memory / Disk I/O monitoring
6. Test Execution Schedule
Phase
Activity
Key Tasks
Step 1
Environment Setup
Infrastructure provisioning, TPC-DS data generation, PostgreSQL loading, component configuration
Step 2
Batch ELT
Execute and measure Spark → Iceberg loading performance
Step 3
Query Performance
Execute Q-01 through Q-08 (Cold/Warm Run), fix query compatibility issues
Step 4
Real-time CDC — Initial Load
Execute R-01 through R-03, compare OLake vs Kafka initial load throughput
Step 5
Real-time CDC — Change Propagation
Execute R-04 through R-11, measure latency and data consistency
Step 6
Analysis and Reporting
Consolidate results, analyze bottlenecks, produce final report
7. Report Template
The tables below serve as report templates. Actual values will be populated after test execution.
7.1 Batch ELT Results Summary
SF
Tables
Total Rows
Total Size
Load Time
Throughput
1
24
19,557,579
~264 MB
324s
57K rows/s
100
24
—
~100 GB
—
—
7.2 CDC Initial Load Comparison
Path
Method
Data
Elapsed Time
Throughput
Notes
A
OLake
10,550,966 rows (3 tbl)
125s
84K rows/s
Direct loading without Kafka
B
Kafka CDC (optimized)
19,557,579 rows (24 tbl)
~600s
~33K rows/s
Debezium + Kafka
B
Kafka CDC (default)
19,557,579 rows (24 tbl)
~1,740s
~11K rows/s
Default settings
⚠️ Path A (OLake) and Path B (Kafka CDC) target different numbers of tables (3 vs 24), so comparison should be based on per-row throughput (rows/s). For a fair comparison, the SF-100 test will target the same set of tables across both paths.
7.3 CDC Real-time Results Summary
Test
Row Count
P50 (ms)
P95 (ms)
P99 (ms)
Max (ms)
Path
Single Row
1
—
—
—
—
A, B
Burst 1M
1,000,000
—
—
—
—
A, B
Sustained
60,000
—
—
—
—
A, B
Mixed DML
10,000
—
—
—
—
A, B
Peak Load
600,000
—
—
—
—
A, B
7.4 Query Performance Results Summary
SF
Queries
Success Rate
Geometric Mean
Min
Max
Cold / Warm
1
99
100%
1.044s
0.150s
21.793s
1.044s / —
100
99
—
—
—
—
— / —
7.5 Concurrency Test Results
Concurrent Users
Geometric Mean
Throughput (queries/hr)
Performance Degradation
1
—
—
baseline
2
—
—
—
4
—
—
—
8
—
—
—
8. Pass/Fail Criteria
8.1 Batch ELT
Criteria
Threshold
Data consistency
100% source-target row count match
SF-100 load time
Under 3 hours
Throughput
Minimum 10K rows/s
8.2 Real-time CDC
Criteria
Threshold
Applicable Path
Initial load data consistency
100% source-target row count match
A, B
Initial load throughput
Confirm Path A (OLake) outperforms Path B (Kafka CDC)
A, B
Single-row E2E latency (P95)
Under 3 seconds
A, B
Sustained load latency (P95)
Under 10 seconds
A, B
CDC data consistency
100% source-target match for INSERT / UPDATE / DELETE
A, B
Post-recovery consistency
Zero data loss
A, B
8.3 Query Performance
Criteria
Threshold
SF-1 Geometric Mean
Under 5 seconds
SF-100 Geometric Mean
Under 60 seconds
4-user concurrency degradation
Within 50% of single-user baseline
Pass/fail thresholds may be adjusted based on actual hardware specifications and cluster resource availability.