
GeoSQL: We Showed a Map to an AI - Accuracy Jumped 4x
Ask an AI to analyze geospatial data and it writes solid SQL — but numbers alone can't reveal geometric errors. GeoSQL closes the loop: the AI runs the query, renders the results as a map, reviews it visually, and self-corrects if something looks off. Fully on-premises, no SaaS account needed.
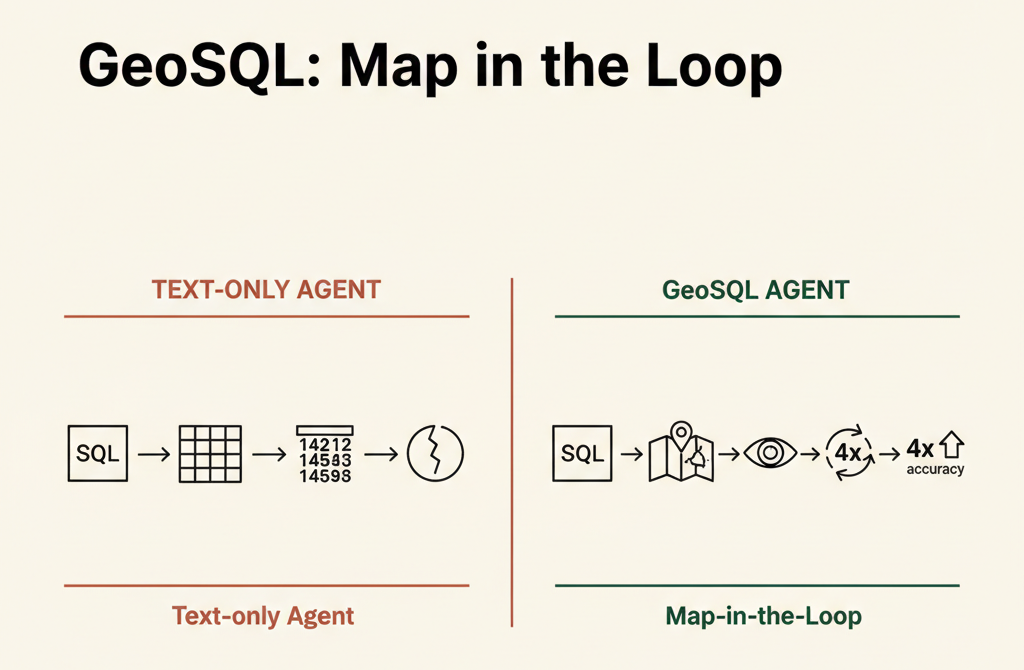
The most common mistake in geospatial analysis is one that numbers will never reveal. The query runs cleanly, the figures look plausible. Then you render it on a map and discover that a single district in Mapo-gu is covering all of Seoul, or that the same area has been counted twice. The only way to catch this is to look at the map. GeoSQL brings that "look at the map" step inside the AI loop.
1. What is GeoSQL?
GeoSQL is a geospatial analysis skill you install into Claude, Codex, or GitHub Copilot.
"Put a map inside the agent loop — errors invisible in text become obvious on a map."
In plain terms: you ask a question in natural language, the AI writes spatial SQL, renders the result as a map, reviews it, and if something looks wrong it rewrites the query and runs it again. It supports PostGIS, BigQuery, Snowflake, and Wherobots — and runs fully on-premises without any SaaS account.
2. Why Aren't Existing AI Agents Enough?
AI Can't See a Map
A typical AI agent receives SQL results as a text table. If you ask for "school accessibility analysis by borough in London," the agent gets back numbers and reports "done."
But what if the City of London (~3 km²) was mistakenly mapped to a Greater London (~1,572 km²) polygon? The numbers won't look suspicious. On a map, the error is immediately obvious. An agent that only reads text will let this pass.
Spatial SQL Has Dialects
Even something as simple as a distance calculation differs across databases. PostGIS uses ST_Distance, BigQuery uses ST_DISTANCE, Snowflake uses ST_DISTANCE — but with different coordinate system handling. H3 grid aggregation support also varies by platform. When a general-purpose AI mixes these up, the query runs, but returns wrong results.
Big Data Spatial Queries Have Unpredictable Costs
A single spatial query that scans an entire national building polygon table in BigQuery can cost tens of dollars. If an agent fires off queries without any cost check, you'll only see the bill after the results come back.
3. How Does GeoSQL Work?
Let's walk through the request: "Show me the top 10 commercial areas in Gangnam-gu, Seoul with high foot traffic and far from competing convenience stores — on a map."
Step 1 — Database Exploration
The AI reads the database directly to see what tables and columns exist. Instead of guessing the schema, it queries actual metadata before writing SQL. It also automatically explores Overture Maps (open global map data) shared datasets on BigQuery and Snowflake.
Step 2 — SQL Generation
It selects the appropriate spatial functions for the connected database and writes the SQL. PostGIS → ST_Distance. BigQuery → H3 grid aggregation. The choice is made automatically.
Step 3 — Cost Pre-Check (BigQuery)
Before executing the query, it calculates "how many GB will this scan?" The default ceiling is 10 GiB. If the estimate exceeds that, the query isn't run — instead, GeoSQL narrows the search scope or adds filters to rewrite a cheaper query automatically.
Step 4 — Result Validation
From the query results, it calculates total area for polygons or total length for lines. Nonsensical outputs — like "the area of Gangnam-gu is larger than all of Seoul" — are caught at this stage.
Step 5 — Render the Map and Look at It (The Key Step)
Results are rendered into a Kepler.gl map via Dekart. The rendered map image is then fed back to the AI. If it spots a visual anomaly — "this polygon is weirdly large," "these points are in the ocean" — it revises the SQL and reruns the full loop.
Natural language question
  → DB exploration (schema discovery)
    → SQL generation (auto-select functions by DB)
      → Cost check (rewrite if > 10 GiB)
        → Result validation (area/length cross-check)
          → Map rendering → AI reviews the map
            → If wrong, revise → loop again
In GeoSQL's benchmark, performance was 4x better with the map feedback loop enabled versus disabled. Geometric errors that passed text validation were caught the moment the map was rendered.
4. Dekart: The Map Rendering Engine
The tool GeoSQL uses to render maps is Dekart — a self-hosted backend for Kepler.gl, the open-source map visualization library built by Uber.
# Run locally with a single line
docker run -p 8080:8080 dekartxyz/dekart
One Docker command, works out of the box. Deploy to an internal server or run it locally. Database authentication uses your local CLI (bq, snow, etc.), so warehouse credentials are never passed to the AI.
5. Try It Yourself
Install in Claude Code
pip install geosql
geosql install claude
Or from within Claude Code:
/plugin marketplace add dekart-xyz/geosql
/plugin install geosql
Enable Map Feedback (Optional)
# Start Dekart
docker run -p 8080:8080 dekartxyz/dekart

# Install Dekart CLI and configure DB connection
pip install dekart && dekart init
dekart init walks you through connecting PostGIS, BigQuery, or Snowflake interactively. GeoSQL works without Dekart, but the map feedback loop (the 4x improvement) only activates once Dekart is connected.
Sample Prompts to Try
/geosql Show me buildings in Ottawa with poor school accessibility on a map
![[20260709_GeoSQL_ottawa_result.png]]
/geosql Map EV charger density within 5km of major roads in Guro-gu, Seoul,
        broken down by highway vs. arterial road
![[20260709_GeoSQL_guro_ev_result.png]]
What GeoSQL did automatically:
- Collected major roads (highways, arterials) and EV charger locations within Guro-gu's bounding box via Overpass API
- Split roads into segments, then counted EV chargers within 5 km of each segment using the Haversine formula (DuckDB)
- Classified by road type and rendered in a Dekart map
| Road Type | Segments | Notes |
|---|---|---|
| Motorway | 125 | Olympic Expressway, Gyeongbu Expressway |
| Trunk | 994 | National Route 1 |
| Primary | 3,601 | Digital-ro, Nambusunhwan-ro |
| EV Chargers (OSM) | 25 | Up to 21 chargers/segment within 5 km |
Chargers are concentrated at urban interchange areas (Guro Digital Complex, Gasan, Sindorim), while outer segments of the Gyeongbu and Olympic expressways show clear infrastructure gaps.
6. Text-Only Agent vs. GeoSQL
| Text-Only Agent | GeoSQL | |
|---|---|---|
| Geometric error detection | Numeric outliers only | Visual map verification |
| Schema discovery | Guessed or user-provided | Queried directly from DB |
| SQL dialect handling | Prone to confusion | Auto-selected per engine |
| Query cost management | None | Pre-estimated, auto-rewritten |
| Output | Tables & numbers | Interactive map |
| On-premises operation | Depends on the agent | Fully supported via one Docker command |
| Performance | Baseline | 4x better |
One line: A text-only agent executes SQL. GeoSQL executes SQL and checks the map.
7. Limitations
Map feedback requires Dekart. The 4x improvement only applies when Dekart is connected. Without it, GeoSQL behaves much like a standard SQL agent.
Cost guardrails are BigQuery-only. Pre-execution cost estimation and automatic query rewriting are supported for BigQuery only. PostGIS and Snowflake run without cost controls.
The benchmark is still small. Published evaluations cover 3 cities (London, Berlin, Paris) and 8 test cases. Performance on complex real-world data requires independent validation.
Air-gapped environments need extra setup. GeoSQL assumes pip install geosql and Docker are available. Environments with restricted package access will require additional preparation.
8. Closing Thoughts
The root cause of AI mistakes in geospatial analysis isn't a lack of SQL ability — it's a lack of visibility. When an agent only receives a table of numbers, there's no way to notice that a polygon is suspiciously large or that a point has been placed in the ocean.
GeoSQL's approach is simple: show the AI the map.
For organizations handling spatial data in on-premises or air-gapped environments, the GeoSQL + Dekart combination is a viable option. It keeps your data in-house while enabling AI-agent-grade spatial analysis.