
Real-time Log Collection and Analysis Case Study
A case study on building a monitoring system that collects API Gateway logs in real-time using Kafka-based streaming architecture, stores them in StarRocks, and visualizes them with Apache Superset. This achieves improved service stability and reduced incident response time.
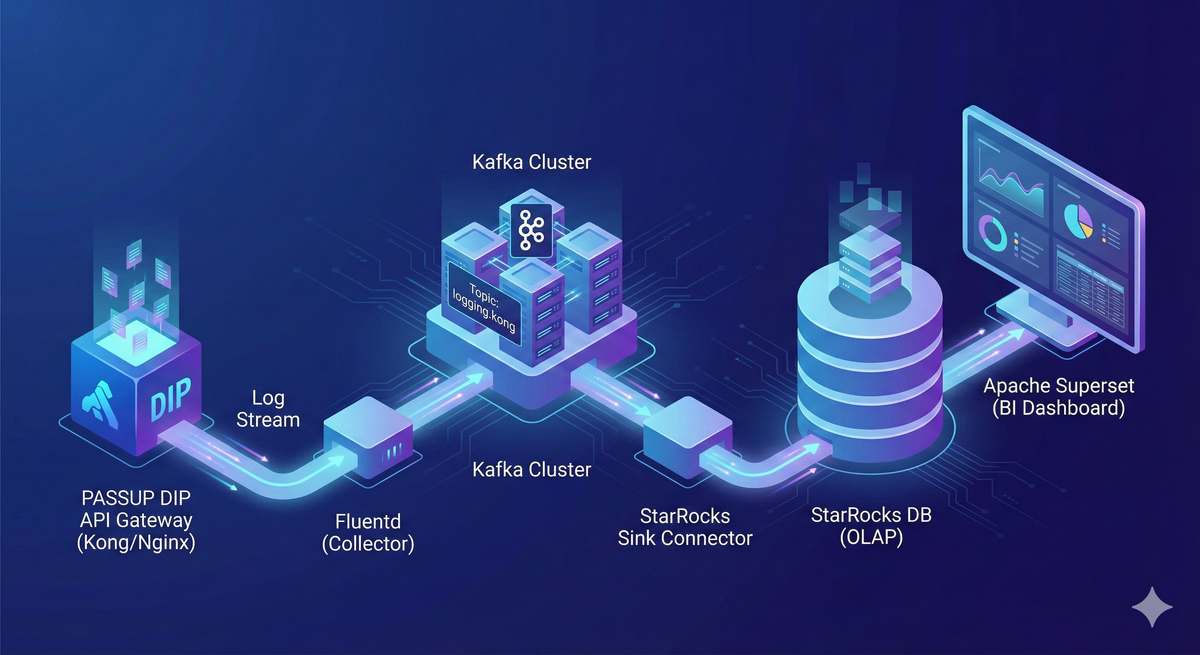
Table of Contents
1. Overview
This document covers a case study of building a system for real-time collection and analysis of PASSUP DIP's API Gateway logs. Using a Kafka-based message streaming architecture, log data is stored in a Target DB and the service status can be monitored in real-time through BI tools.
Implementation Environment
- Message Broker: kafka-cluster
- Log Producer: fluentd
- Kafka Connector: StarRocks Sink Connector
- Target DB: StarRocks
- Kafka Monitoring: Kafbat UI
- BI Tool: Apache Superset
Real-time Log Collection Architecture
2. Log Collection
API Gateway Log Message Format Configuration
You can define the log message format in the values.yaml file when deploying the API Gateway.
values.yaml Configuration Example
env:
  proxy_access_log: "/dev/stdout custom_fmt"
  # Custom log format definition
  nginx_http_log_format: >-
    custom_fmt '$remote_addr [$time_local] "$request" $status $request_time $upstream_response_time "$http_host" "$http_user_agent"'
  real_ip_header: "X-Forwarded-For"
  real_ip_recursive: "on"
Log Format Variable Descriptions
| Variable Name | Meaning | Detailed Description |
|---|---|---|
| $remote_addr | Client IP | Actual Client IP that sent the request. real_ip configuration needed when Proxy or LB is present |
| $time_local | Request time (local timezone) | Server local time in [10/Dec/2025:10:23:10 +0900] format |
| $request | Request line | Complete request string in "GET /api/v1/foo HTTP/1.1" format |
| $status | HTTP response code | Status code returned to client such as 200, 404, 500 |
| $request_time | Total request processing time | Total processing time from request reception to response completion (in seconds) |
| $upstream_response_time | Upstream response time | Backend service response time (in seconds), used for backend delay analysis |
| $http_host | Original Host header | Host value from client request, used to identify Ingress domain |
| $http_user_agent | User-Agent | UA string identifying browser/CLI/bot, utilized for security and debugging |
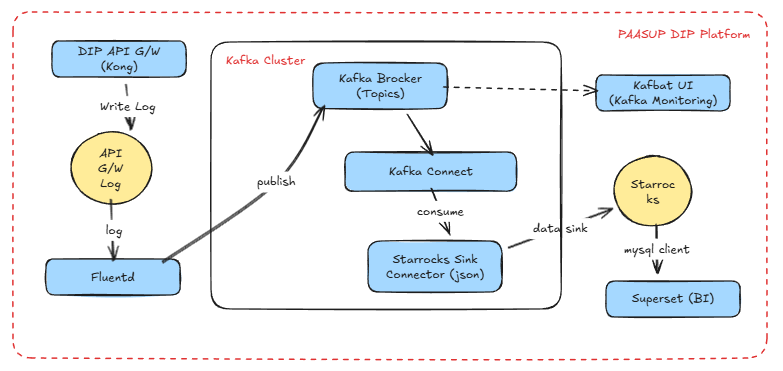
API Gateway Log Collection and Kafka Transmission Process
In PAASUP DIP, logs are collected through the following procedure and messages are sent to the Kafka logging.kong topic.
- Kong application generates container logs
- Fluent-bit DaemonSet collects logs from all nodes
- Flow CR filters only logs with Kong labels
- Fluentd StatefulSet processes logs into JSON format
- Transmission to Kafka topic
logging.kongthrough ClusterOutput - Secure communication with Kafka using SCRAM-SHA-512 authentication and TLS
Note: The above process is automatically configured as the platform's default logging pipeline.
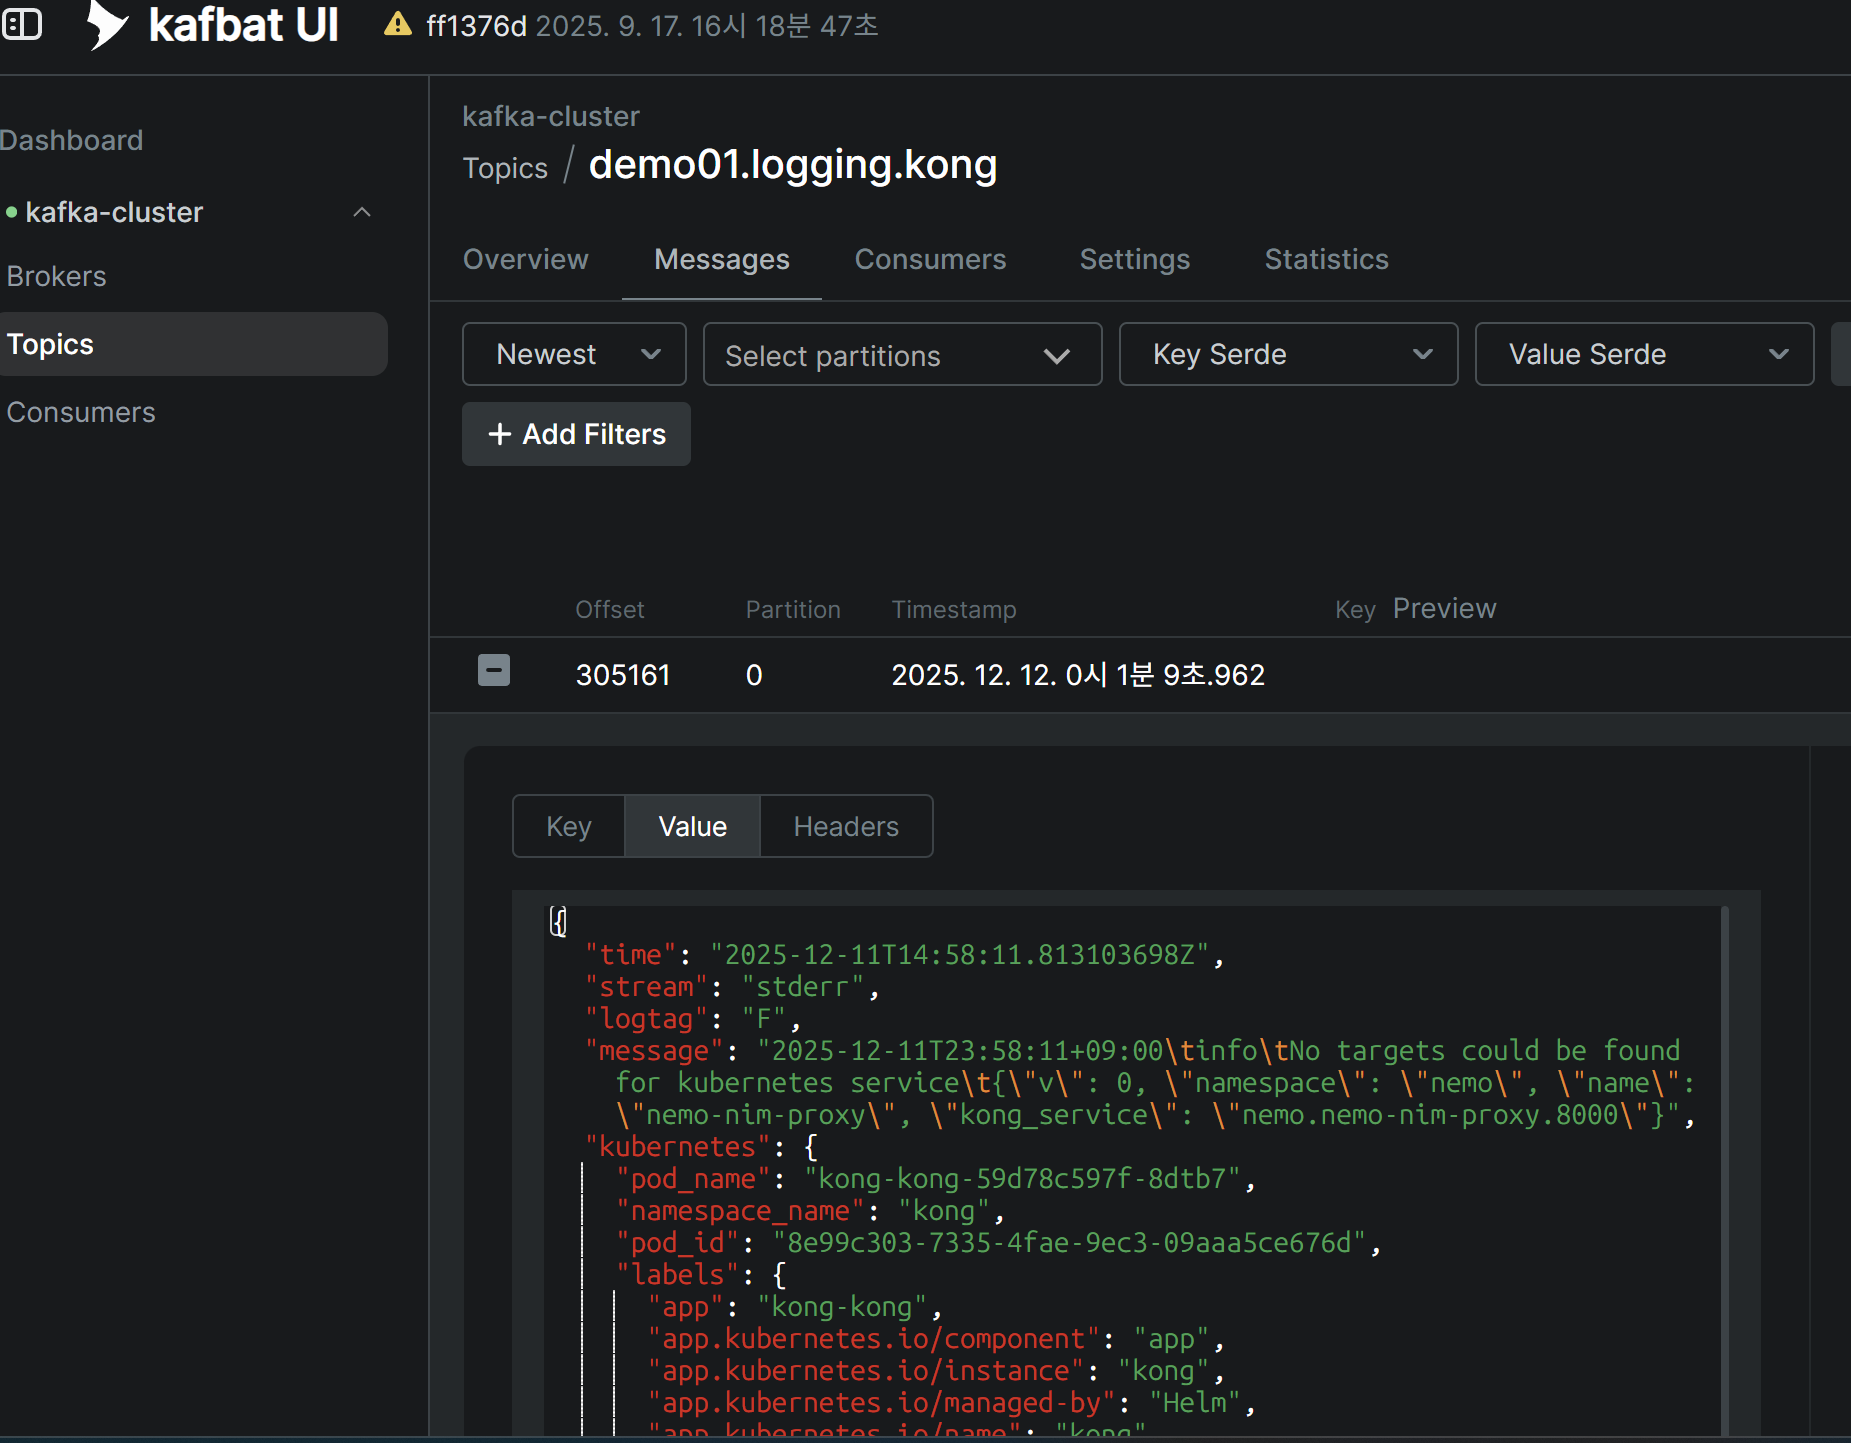
Log Collection Verification
You can view JSON messages from the logging.kong topic in real-time through Kafbat UI.
3. Log Data Sink
Target Table Creation
Create a table in the Target DB (StarRocks) matching the JSON message structure of the logging.kong topic.
Key Considerations:
- The
timecolumn is in UTC timezone, so add akst_timecomputed column to convert to Korean time kubernetes,kubernetes_namespaceare nested JSON structures, so declare them as JSON data type
USE quickstart;

CREATE TABLE IF NOT EXISTS kong_log_events (
    time DATETIME,
    stream STRING,
    logtag STRING,
    message STRING,
    kubernetes JSON,
    kubernetes_namespace JSON,
    kst_time DATETIME AS convert_tz(time, 'UTC', 'Asia/Seoul')
) ENGINE = OLAP
DUPLICATE KEY(time)
DISTRIBUTED BY HASH(kst_time) BUCKETS 10;
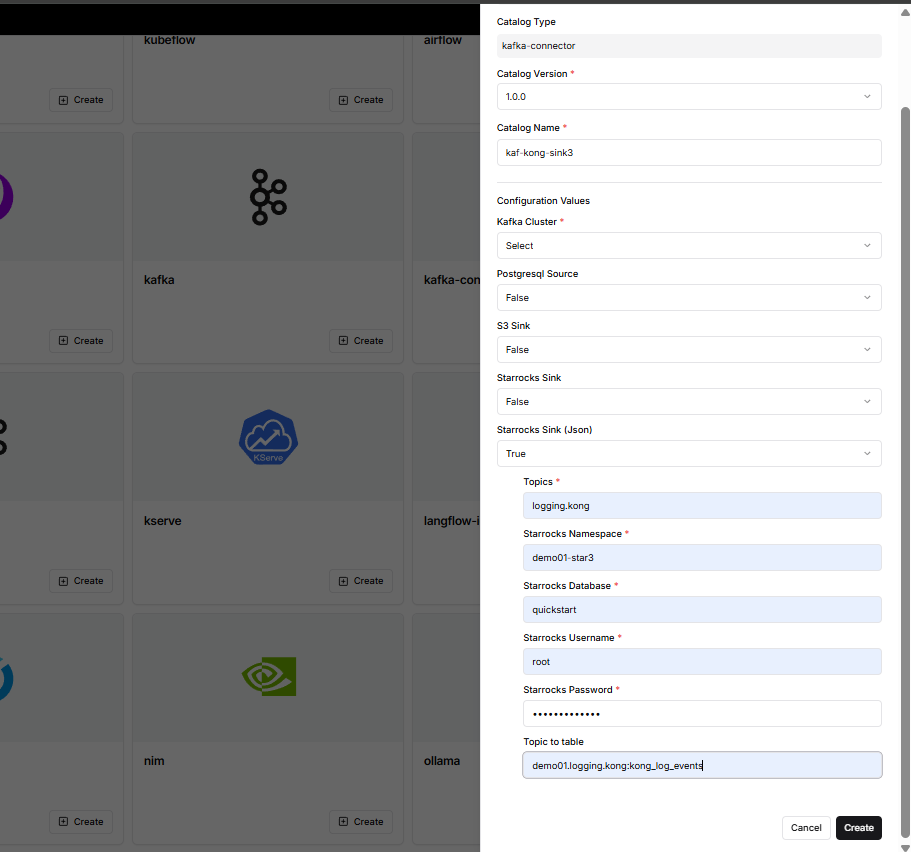
StarRocks Sink Connector Creation and Data Loading
You can easily create a Kafka Connector from the DIP catalog creation menu.
Creation Procedure:
- Click
Create kafka-connectorin theCatalog Creationmenu - Select StarRocks Sink(Json) from Connector types
- Enter required information:
- Topic name
- StarRocks Namespace
- StarRocks Database
- StarRocks Username
- StarRocks Password
- Topic to table mapping information
- Click
Createbutton
Immediately after Connector creation, Kafka messages are consumed and data is loaded in real-time into StarRocks' kong_log_events table.
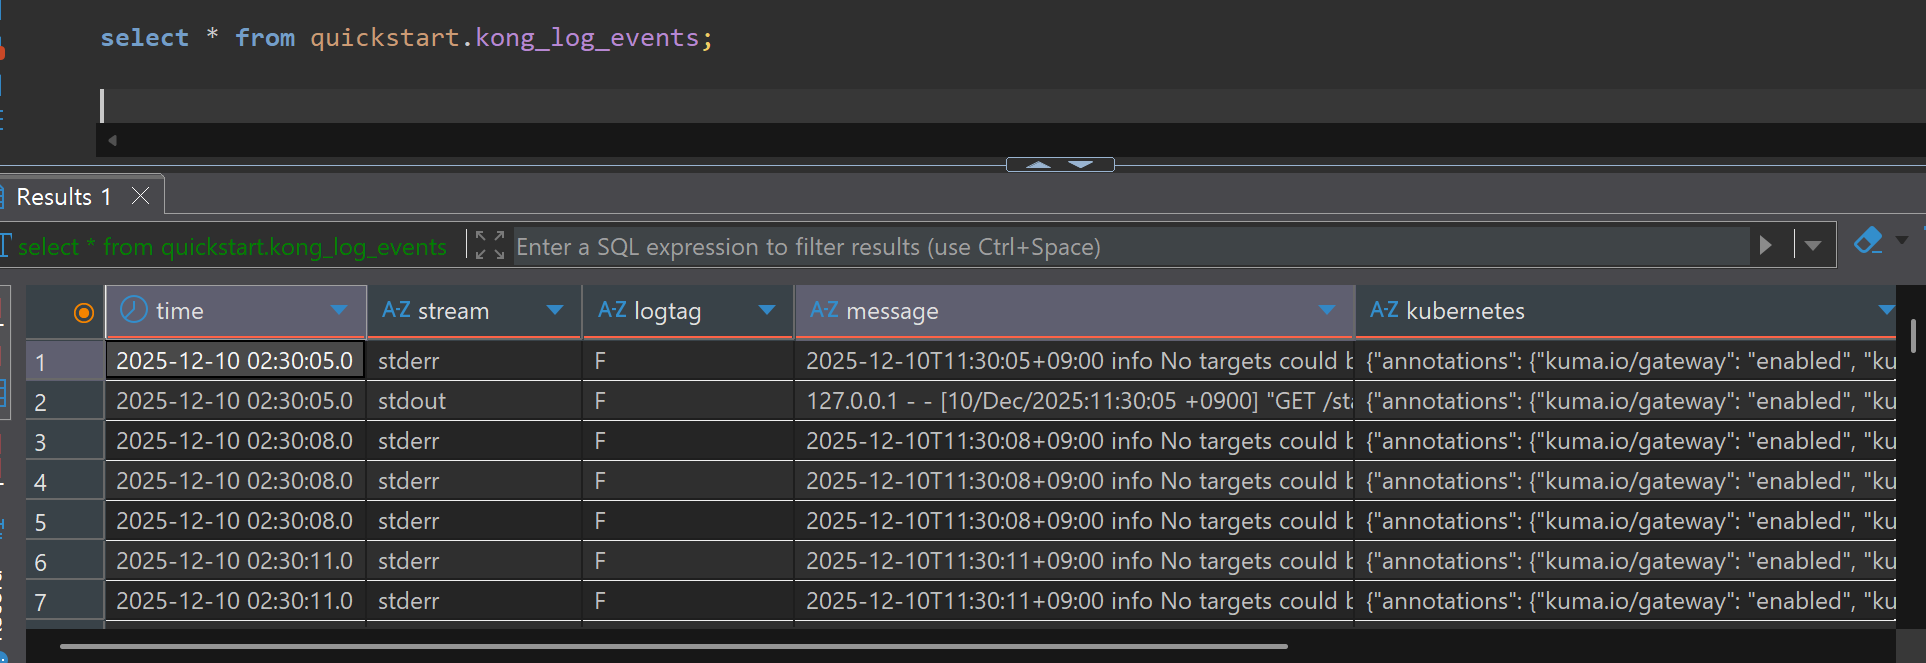
Data Loading Verification
You can query the loaded data from SQL Client.
SELECT * FROM quickstart.kong_log_events;
4. Visualization
Step 1: Superset Dataset Creation
Since raw log data is stored as strings in the message column, regular expression functions must be used to extract information needed for analysis. Repeating complex regex queries for each chart causes performance degradation and management difficulties, so we efficiently manage using Virtual Dataset.
Dataset Creation Method:
- Execute the query below in SQL Lab
- Click
Save as Dataset - Dataset name:
kong_parsed_logs - Use this Dataset as the data source for all charts
SELECT
    kst_time,
    split_part(message, ' ', 1) AS client_ip,
    regexp_extract(message, 'HTTP/[0-9.]+" [0-9]+ ([0-9.]+)', 1) AS response_time,
    regexp_extract(message, 'HTTP/[0-9.]+" [0-9]+ [-0-9. ]+ "(.*?)"', 1) AS host_domain,
    CASE
        WHEN regexp_extract(message, 'HTTP/[0-9.]+" [0-9]+ [-0-9. ]+ "(.*?)"', 1) LIKE '%-%'
        THEN split_part(regexp_extract(message, 'HTTP/[0-9.]+" [0-9]+ [-0-9. ]+ "(.*?)"', 1), '-', 1)
        ELSE 'platform'
    END AS project_name,
    split_part(regexp_extract(message, '"(GET|POST|PUT|DELETE|HEAD|OPTIONS) (.*?) HTTP', 2), '?', 1) AS request_url,
    regexp_extract(message, 'HTTP/[0-9.]+" ([0-9]{3})', 1) AS status_code,
    message
FROM
    quickstart.kong_log_events
WHERE
    stream = 'stdout'
    AND message LIKE '%HTTP/%' -- Filter Access Log only
    AND message REGEXP '^[0-9]{1,3}\\.[0-9]{1,3}\\.[0-9]{1,3}\\.[0-9]{1,3}'  -- Filter logs starting with IP only
    AND split_part(message, ' ', 1) != '127.0.0.1'  -- Exclude Kong health check
    -- Inject dynamic filter using Jinja Template
    {% if from_dttm %}
    AND kst_time >= '{{ from_dttm }}'
    {% endif %}
    {% if to_dttm %}
    AND kst_time < '{{ to_dttm }}'
    {% endif %}
Step 2: Dashboard Chart Configuration
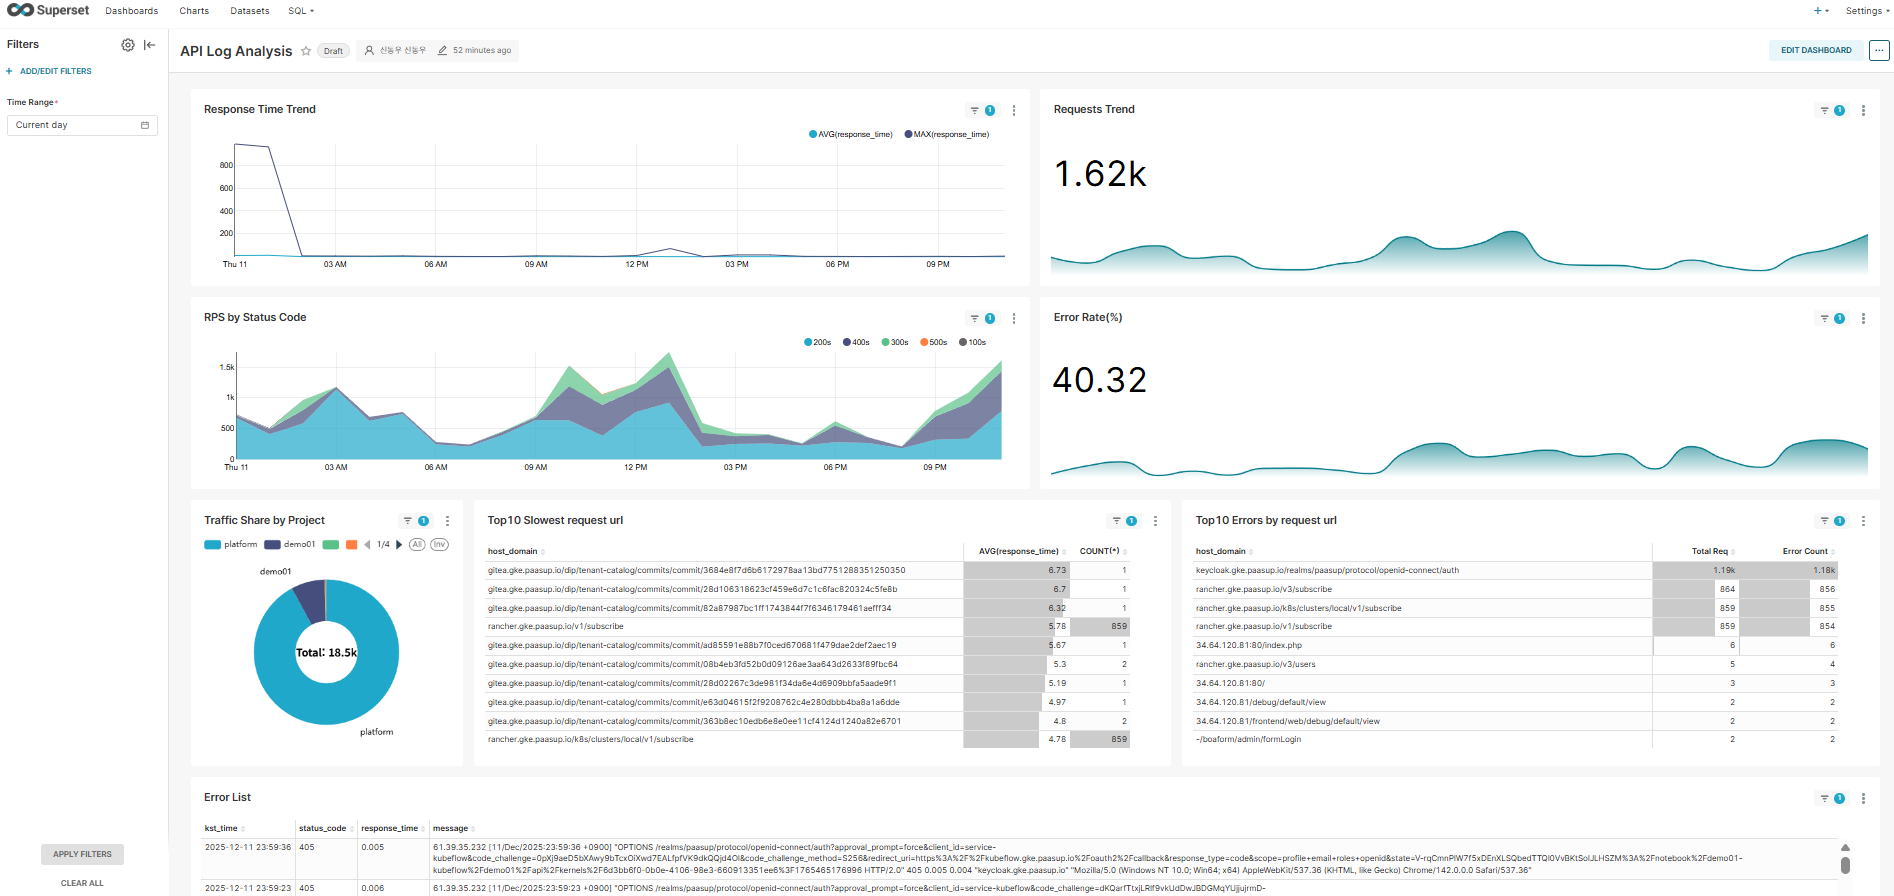
Create various monitoring charts using the kong_parsed_logs Dataset.
1) Response Time Trend
- Chart Type: Time-series Line Chart
- Time Column: kst_time
- Metrics: AVG(response_time), MAX(response_time)
- Description: Monitor response time trends in real-time
2) Requests Trend
- Chart Type: Big Number
- Metric: COUNT(*)
- Time Grain: HOUR
- Description: Total request count trend per hour
3) RPS by Status Code
- Chart Type: Time-series Chart (Stacked Area)
- Time Column: kst_time
- Dimensions: status_code
- Metrics: COUNT(*)
- Description: Visualize request distribution by status code
4) Error Rate (%)
- Chart Type: Big Number with Trendline
- Custom Metric:
SUM(CASE WHEN status_code >= 400 THEN 1 ELSE 0 END) * 100.0 / COUNT(*) - Time Grain: HOUR
- Description: Monitor error rate (%) trend
5) Traffic Share by Project
- Chart Type: Pie Chart
- Dimensions: project_name
- Metric: COUNT(*)
- Description: Analyze traffic share by project
6) Top 10 Slowest Request URL
- Chart Type: Table
- Dimensions: concat(host_domain, request_url)
- Metrics: AVG(response_time), COUNT(*)
- Sort By: AVG(response_time) Descending
- Row Limit: 10
- Description: Identify request URLs with slowest average response time
7) Top 10 Errors by Request URL
- Chart Type: Table
- Dimensions: concat(host_domain, request_url)
- Metrics:
- COUNT(*) (Total Requests)
- Custom Metric:
SUM(CASE WHEN status_code >= 400 THEN 1 ELSE 0 END)(Error Count)
- Sort By: Error Count Descending
- Row Limit: 10
- Description: Identify URLs with most errors
8) Error List
- Query Mode: RAW RECORDS
- Filters: status_code >= 400
- Columns: kst_time, status_code, response_time, message
- Ordering: kst_time DESC
- Description: View detailed messages of recent error logs
Step 3: Dashboard Filter Application (Native Filters)
Add a Time Range Filter to dynamically control the entire dashboard.
- Filter Type: Time Range
- Default Value: Current day
- Scope: All charts
Performance Optimization Tips
In large-scale traffic environments (thousands of requests per second or more), querying the raw table (quickstart.kong_log_events) directly can slow down dashboard response time.
Recommended Optimization Methods:
- Use StarRocks' Materialized View to create 10-minute aggregation tables
- Connect aggregation tables as Superset Datasets
- Maintain real-time nature while significantly improving query performance
5. Conclusion
This document constructed a complete pipeline that collects API Gateway logs in real-time using Kafka-based streaming architecture, stores them in StarRocks, and visualizes them with Apache Superset.
Key Achievements
- Real-time Monitoring: Real-time identification of API Gateway request patterns, response times, error rates, etc.
- Reduced Incident Response Time: Fast root cause analysis through real-time detailed logs when errors occur
- Data-driven Decision Making: Resource optimization and capacity planning through project-specific traffic analysis
- Scalable Architecture: Stable performance even for high-volume log processing through combination of Kafka and StarRocks
Future Improvement Directions
- Machine Learning-based Anomaly Detection: Automatic detection of abnormal traffic compared to normal patterns
- Multi-cluster Support: Integrated monitoring of logs from multiple Kubernetes clusters
This real-time log analysis system greatly contributes to service stability improvement and operational efficiency, and can establish itself as core infrastructure for DevOps culture adoption.