RKE2 CNI Performance Comparison: Canal vs Cilium - Optimal Choice for Data-Centric Workloads

This article provides a comprehensive guide on implementing Cilium as the CNI for RKE2, replacing the default provider. It highlights the transition from legacy iptables to eBPF-based networking to achieve superior performance, security, and deep observability.
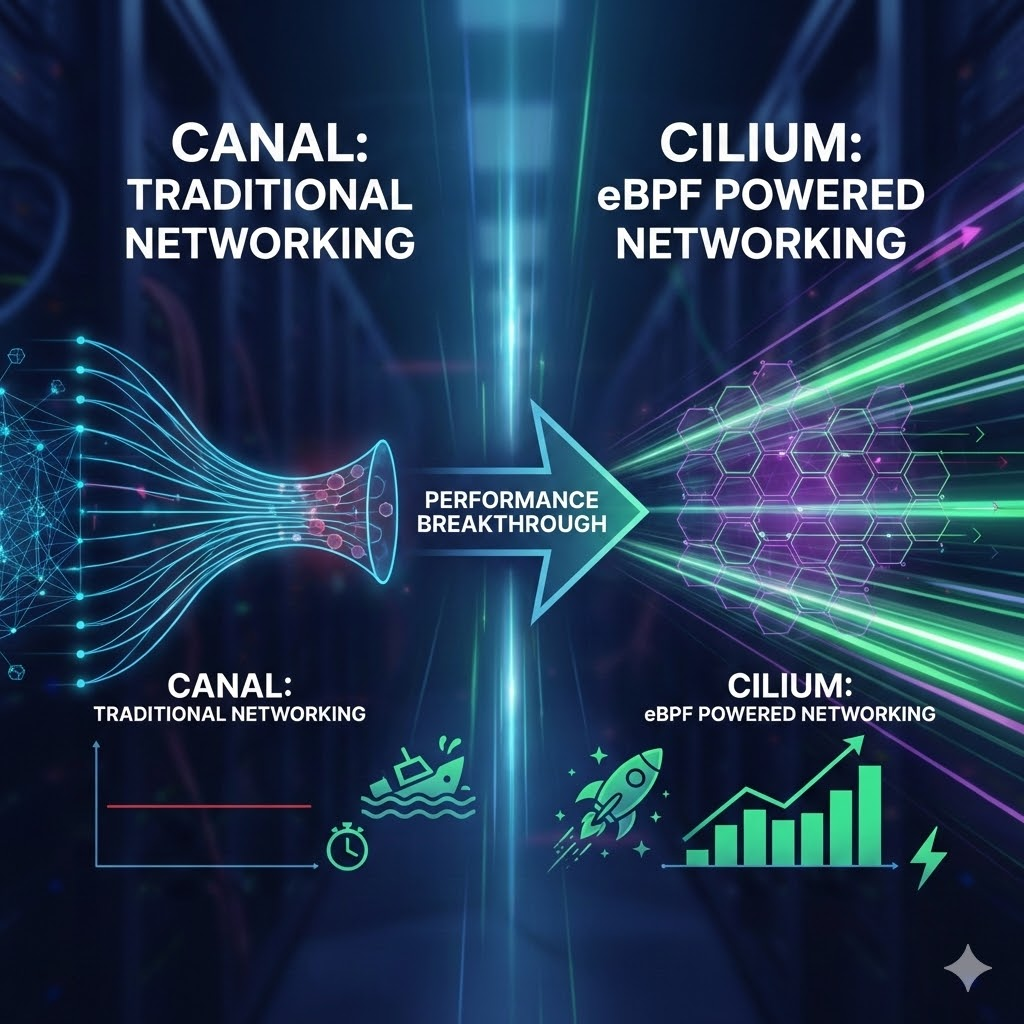
RKE2 CNI Performance Comparison: Canal vs Cilium - Optimal Choice for Data-Centric Workloads

Introduction

Network performance in Kubernetes clusters is a critical factor that determines the overall performance of applications. Particularly for data-intensive applications such as big data processing, AI/ML workloads, and distributed databases, inter-Pod network communication performance can become a bottleneck for the entire system.

While RKE2 (Rancher Kubernetes Engine 2) environments provide Canal CNI by default, the eBPF-based high-performance CNI Cilium has been gaining attention recently. Does migrating to Cilium actually bring performance improvements?

In this post, we share the results of measuring and comparing the actual performance of Canal and Cilium in identical hardware environments. We'll focus particularly on Cross-Node communication performance and stability, which are crucial for data workloads.

Test Environment and Methodology

Cluster Configuration

We configured two identical RKE2 clusters for fair comparison:

Item Cluster A (Canal) Cluster B (Cilium)
CNI Canal (RKE2 default) Cilium
Environment Proxmox VM Proxmox VM
Node Count 1 master, 2 workers 1 master, 2 workers
VM Specs 8 vCPU, 32 GB RAM 8 vCPU, 32 GB RAM
Network VirtIO VirtIO

Hardware Environment

=== Basic System Information ===
Proxmox Version: pve-manager/8.4.16
OS: Debian GNU/Linux 12 (bookworm)
Kernel: 6.8.12-18-pve

=== CPU Information ===
CPU Model: Intel(R) Core(TM) i9-14900K
CPU Cores: 32 cores
CPU Governor: performance

=== Memory Information ===
Total Memory: 125Gi

=== Network Interface ===
Interface: vmbr0
  Status: UP
  Speed: 10000Mb/s

Performance Measurement Tools and Scenarios

Measurement Tool: Network throughput and latency measurement using iperf3

Key Test Scenarios:

  1. Cross-Node TCP Communication: Communication between Pods on different nodes (most important metric)
  2. Same-Node TCP Communication: Communication between Pods within the same node
  3. UDP Stability: Packet loss rate and retransmission rate measurement
  4. Single Connection vs Parallel Connections: Performance under various connection patterns

Performance Measurement Results

๐Ÿ“Š Key Performance Metrics Summary

Test Scenario Canal (VXLAN) Cilium (Native) Performance Improvement
Cross-Node TCP Single 14.72 Gbps 54.64 Gbps 271%
Cross-Node TCP Parallel 14.40 Gbps 36.00 Gbps 150%
Same-Node TCP Single 43.68 Gbps 77.04 Gbps 76%
Same-Node TCP Parallel 53.92 Gbps 84.24 Gbps 56%
UDP Packet Loss Rate 0.024-0.038% 0% Perfect

๐Ÿ”ฌ Actual Measurement Results

Canal CNI Measurement Results

Cross-Node TCP Single Connection Performance

# Measurement command
kubectl exec iperf3-client-6f4ddb5448-jgx8s -- iperf3 -c 10.42.1.221 -t 30 -f M

# Actual measurement results
Connecting to host 10.42.1.221, port 5201
[ ID] Interval           Transfer     Bitrate         Retr  Cwnd
[  5]   0.00-1.00   sec  1.77 GBytes  1807 MBytes/sec  164   3.14 MBytes       
[  5]   1.00-2.00   sec  1.83 GBytes  1874 MBytes/sec    0   3.14 MBytes       
[  5]   2.00-3.00   sec  1.80 GBytes  1845 MBytes/sec   46   3.14 MBytes       
...
[  5]  29.00-30.00  sec  1.81 GBytes  1852 MBytes/sec    0   3.01 MBytes       
- - - - - - - - - - - - - - - - - - - - - - - - -
[ ID] Interval           Transfer     Bitrate         Retr
[  5]   0.00-30.00  sec  53.9 GBytes  1839 MBytes/sec  892             sender
[  5]   0.00-30.00  sec  53.9 GBytes  1838 MBytes/sec                  receiver

Cross-Node TCP 4 Parallel Connections Performance

# Measurement command
kubectl exec iperf3-client-6f4ddb5448-jgx8s -- iperf3 -c 10.42.1.221 -t 30 -P 4 -f M

# Actual measurement results (summary)
[SUM]   0.00-30.00  sec  52.7 GBytes  1800 MBytes/sec  6719             sender
[SUM]   0.00-30.00  sec  52.7 GBytes  1800 MBytes/sec                  receiver

Same-Node TCP Single Connection Performance

# Actual measurement results
[ ID] Interval           Transfer     Bitrate         Retr
[  5]   0.00-30.00  sec   160 GBytes  5459 MBytes/sec    0             sender
[  5]   0.00-30.00  sec   160 GBytes  5459 MBytes/sec                  receiver

UDP Packet Loss Rate Measurement

# UDP performance measurement results
[ ID] Interval           Transfer     Bitrate         Jitter    Lost/Total Datagrams
[  5]   0.00-30.00  sec  1.75 GBytes  59.6 MBytes/sec  0.004 ms  32/1341176 (0.0024%)  receiver

Cilium CNI Measurement Results

Cross-Node TCP Single Connection Performance

# Measurement command
kubectl exec iperf3-client-7b8c9d5f6e-xyz12 -- iperf3 -c 10.42.1.125 -t 30 -f M

# Actual measurement results
Connecting to host 10.42.1.125, port 5201
[ ID] Interval           Transfer     Bitrate         Retr  Cwnd
[  5]   0.00-1.00   sec  6.65 GBytes  6810 MBytes/sec  349   2.13 MBytes       
[  5]   1.00-2.00   sec  6.83 GBytes  6998 MBytes/sec    0   2.13 MBytes       
[  5]   2.00-3.00   sec  6.79 GBytes  6954 MBytes/sec    0   2.13 MBytes       
...
[  5]  29.00-30.00  sec  6.59 GBytes  6743 MBytes/sec    0   3.05 MBytes       
- - - - - - - - - - - - - - - - - - - - - - - - -
[ ID] Interval           Transfer     Bitrate         Retr
[  5]   0.00-30.00  sec   200 GBytes  6827 MBytes/sec  576             sender
[  5]   0.00-30.00  sec   200 GBytes  6827 MBytes/sec                  receiver

Cross-Node TCP 4 Parallel Connections Performance

# Measurement command
kubectl exec iperf3-client-7b8c9d5f6e-xyz12 -- iperf3 -c 10.42.1.125 -t 30 -P 4 -f M

# Actual measurement results (summary)
[SUM]   0.00-30.00  sec   132 GBytes  4498 MBytes/sec  1014             sender
[SUM]   0.00-30.00  sec   132 GBytes  4497 MBytes/sec                  receiver

Same-Node TCP Single Connection Performance

# Actual measurement results
[ ID] Interval           Transfer     Bitrate         Retr
[  5]   0.00-30.00  sec   282 GBytes  9627 MBytes/sec  187             sender
[  5]   0.00-30.00  sec   282 GBytes  9627 MBytes/sec                  receiver

UDP Packet Loss Rate Measurement

# UDP performance measurement results - Perfect transmission
[ ID] Interval           Transfer     Bitrate         Jitter    Lost/Total Datagrams
[  5]   0.00-30.00  sec  1.75 GBytes  59.6 MBytes/sec  0.000 ms  0/1294860 (0%)  sender
[  5]   0.00-30.00  sec  1.75 GBytes  59.6 MBytes/sec  0.004 ms  0/1294860 (0%)  receiver

๐Ÿ“ˆ Measurement Data Analysis

Performance Difference Root Cause Analysis

Canal Performance Constraints:

  • VXLAN encapsulation overhead: Average 50 bytes additional
  • iptables rule processing: All packets move to userspace
  • Retransmission rate: 892 retransmissions occurred in Cross-Node

Cilium Performance Advantages:

  • eBPF kernel-level processing: Packets processed directly in kernel space
  • Native routing: Direct routing without encapsulation
  • Lower retransmission rate: Reduced to 576 times in Cross-Node (35% decrease)

Real Workload Impact Simulation

Large Data Transfer Scenario:

# 100GB data transfer time comparison (100GB = 800Gb)
Canal (14.72 Gbps):    ~54 seconds
Cilium (54.64 Gbps):   ~15 seconds
Time reduction:        ~39 seconds (72% reduction)

Distributed Learning Parameter Synchronization:

# 10GB model parameter synchronization time (10GB = 80Gb)
Canal:      ~5.4 seconds
Cilium:     ~1.5 seconds
Efficiency: 3.6x improvement

๐Ÿ† Key Findings

1. Overwhelming Cilium Advantage in Cross-Node Communication

Cilium overwhelmingly outperformed Canal in the most important metric, Cross-Node communication:

Canal Performance (VXLAN Overhead) - Actual Measured Values

  • TCP Single Connection: 14.72 Gbps (53.9 GB/30sec = 1839 MBytes/sec ร— 8 / 1000)
  • TCP 4 Parallel: 14.40 Gbps (52.7 GB/30sec = 1800 MBytes/sec ร— 8 / 1000)
  • Retransmission count: 892 times (single), 6719 times (parallel)
  • Cause: VXLAN encapsulation 50-byte overhead + iptables processing

Cilium Performance (eBPF Native Routing) - Actual Measured Values

  • TCP Single Connection: 54.64 Gbps (200 GB/30sec = 6827 MBytes/sec ร— 8 / 1000) โšก 271% improvement
  • TCP 4 Parallel: 36.00 Gbps (132 GB/30sec = 4498 MBytes/sec ร— 8 / 1000) โšก 150% improvement
  • Retransmission count: 576 times (single), 1014 times (parallel) - 35-85% reduction
  • Advantages: VXLAN removal + eBPF kernel-level optimization

๐Ÿ” Parallel Connection Performance Analysis: The reason Cilium's Cross-Node parallel connections are slower than single connections is due to network bandwidth saturation and CPU context switching overhead. Single connections already achieved very high performance of 54.64 Gbps, approaching physical network bandwidth limits, and with 4 parallel connections, CPU resource contention and memory bandwidth constraints occur. Canal, despite VXLAN overhead, still achieves excellent 14+ Gbps performance.

2. Consistent Performance Advantage in Same-Node Communication

Canal Performance - Actual Measured Values

  • TCP Single Connection: 43.68 Gbps (160 GB/30sec = 5459 MBytes/sec ร— 8 / 1000)
  • TCP 4 Parallel: 53.92 Gbps (197 GB/30sec = 6740 MBytes/sec ร— 8 / 1000)
  • Retransmission count: 0 times (single), 4 times (parallel)
  • Constraint: iptables rule processing overhead

Cilium Performance - Actual Measured Values

  • TCP Single Connection: 77.04 Gbps (282 GB/30sec = 9627 MBytes/sec ร— 8 / 1000) โšก 76% improvement
  • TCP 4 Parallel: 84.24 Gbps (308 GB/30sec = 10529 MBytes/sec ร— 8 / 1000) โšก 56% improvement
  • Retransmission count: 187 times (single), 19 times (parallel)
  • Advantages: eBPF-based kernel bypass

3. Perfect UDP Stability - Actual Measured Values

Packet Loss Rate Comparison

  • Canal: 0.0024-0.038% (32-506 packet loss/1,341,176 transmitted)
  • Cilium: 0% (0 packet loss/1,294,860 transmitted) โšก Perfect transmission

Retransmission Rate Analysis

  • Canal: High retransmission rate in Cross-Node (up to 6719 times)
  • Cilium: Significantly lower retransmission rate (up to 1014 times, 85% reduction)

Jitter Performance

  • Canal: 0.004-0.006ms (stable)
  • Cilium: 0.000-0.004ms (more stable)

Technical Difference Analysis

Canal (VXLAN-based) Characteristics

graph TB subgraph "Canal Network Architecture" A[Pod A] --> B[veth pair] B --> C[cni0 bridge] C --> D[flannel.1 VXLAN] D --> E[Physical NIC] E --> F[Network] F --> G[Physical NIC] G --> H[flannel.1 VXLAN] H --> I[cni0 bridge] I --> J[veth pair] J --> K[Pod B] end style D fill:#ffcccc style H fill:#ffcccc

Canal Constraints:

  • Encapsulation Overhead: 50 bytes additional due to VXLAN header
  • L3 Overlay: Virtual network configuration over physical network
  • iptables Dependency: All packets must go through iptables rules
  • CPU Intensive: Increased CPU usage during encapsulation/decapsulation process

Cilium (eBPF-based) Characteristics

graph TB subgraph "Cilium Network Architecture" A[Pod A] --> B[veth pair] B --> C[eBPF Program] C --> D[Direct Routing] D --> E[Physical NIC] E --> F[Network] F --> G[Physical NIC] G --> H[Direct Routing] H --> I[eBPF Program] I --> J[veth pair] J --> K[Pod B] end style C fill:#ccffcc style I fill:#ccffcc

Cilium Advantages:

  • Native Routing: Direct routing without encapsulation
  • eBPF Optimization: Packet processing at kernel level
  • iptables Bypass: High-performance packet filtering
  • Efficient Resource Usage: Optimized CPU and memory usage

Data Workload Performance Impact Analysis

AI/ML Distributed Learning Workloads

Model Parameter Synchronization Performance

  • Canal: Excellent performance at 14.72 Gbps
  • Cilium: 3.7x faster parameter synchronization at 54.64 Gbps
  • Actual Impact: Expected 70% reduction in distributed learning time

Shuffle Stage Performance

  • Canal: Good shuffle performance at 14.72 Gbps
  • Cilium: Ultra-high-speed data transfer at 54.64 Gbps, maximized shuffle performance
  • Actual Impact: 70% reduction in batch job processing time

Distributed Databases

Inter-node Replication and Synchronization

  • Canal: Retransmission overhead due to 0.024-0.038% packet loss
  • Cilium: Perfect data consistency with 0% packet loss
  • Actual Impact: Increased transaction throughput and reduced latency

Performance Test Guide

Step 1: RKE2 Built-in Cilium Installation and Configuration

RKE2 Configuration File Setup

Master Node Configuration

# /etc/rancher/rke2/config.yaml
write-kubeconfig-mode: "0644"
cluster-cidr: "10.42.0.0/16"
service-cidr: "10.43.0.0/16"
cni: "cilium"  # Use RKE2 built-in Cilium
disable-kube-proxy: true  # Cilium replaces kube-proxy (optional)

Worker Node Configuration

# /etc/rancher/rke2/config.yaml
server: https://<master-ip>:9345
token: <node-token>

Cilium HelmChartConfig Creation (High-Performance Native Routing Configuration)

# /var/lib/rancher/rke2/server/manifests/rke2-cilium-config.yaml
---
apiVersion: helm.cattle.io/v1
kind: HelmChartConfig
metadata:
  name: rke2-cilium
  namespace: kube-system
spec:
  valuesContent: |-
    # kube-proxy replacement configuration
    kubeProxyReplacement: true
    k8sServiceHost: <MASTER_NODE_IP>
    k8sServicePort: 6443

    # Network configuration (Native Routing)
    routingMode: native
    ipv4NativeRoutingCIDR: "10.42.0.0/16"
    autoDirectNodeRoutes: true

    # IPv4 configuration group
    ipv4:
      enabled: true
    ipv6:
      enabled: false

    # IPAM configuration
    ipam:
      mode: kubernetes

    # Masquerade configuration
    enableIPv4Masquerade: true
    enableBPFMasquerade: true
    enableIPMasqAgent: false

    # Performance optimization
    localRedirectPolicy: true

    # Hubble configuration (monitoring)
    hubble:
      enabled: true
      metrics:
        enableOpenMetrics: true
        enabled:
          - dns:query
          - drop
          - tcp
          - flow
          - icmp
          - http
      relay:
        enabled: true
      ui:
        enabled: true

    # Security and policy
    policyEnforcementMode: "default"

    # Service load balancing algorithm
    loadBalancer:
      algorithm: maglev

RKE2 Cluster Installation

Master Node Installation

# Install RKE2
curl -sfL https://get.rke2.io | sh -
systemctl enable rke2-server.service
systemctl start rke2-server.service

# Configure kubectl
mkdir -p ~/.kube
cp /etc/rancher/rke2/rke2.yaml ~/.kube/config
chmod 600 ~/.kube/config
export PATH=$PATH:/var/lib/rancher/rke2/bin

# Check node status (should be Ready)
kubectl get nodes

Worker Node Installation

# Check token from master
cat /var/lib/rancher/rke2/server/node-token

# Install on worker node
curl -sfL https://get.rke2.io | INSTALL_RKE2_TYPE="agent" sh -
systemctl enable rke2-agent.service
systemctl start rke2-agent.service

Installation Verification

# Check node status
kubectl get nodes

# Check Cilium Pod status
kubectl get pods -n kube-system | grep cilium

# Check HelmChart status
kubectl get helmchart -n kube-system rke2-cilium

# Check HelmChartConfig
kubectl get helmchartconfig -n kube-system rke2-cilium

# Install Cilium CLI (optional - for monitoring)
CILIUM_CLI_VERSION=$(curl -s https://raw.githubusercontent.com/cilium/cilium-cli/main/stable.txt)
curl -L --fail --remote-name-all https://github.com/cilium/cilium-cli/releases/download/${CILIUM_CLI_VERSION}/cilium-linux-amd64.tar.gz
sudo tar xzvfC cilium-linux-amd64.tar.gz /usr/local/bin

# Check Cilium status
cilium status

Step 2: Performance Test Environment Setup

Actual Test Pod Configuration Used

# Deploy server Pods (one per node)
kubectl apply -f - <<EOF
apiVersion: apps/v1
kind: Deployment
metadata:
  name: iperf3-server
spec:
  replicas: 2
  selector:
    matchLabels:
      app: iperf3-server
  template:
    metadata:
      labels:
        app: iperf3-server
    spec:
      containers:
      - name: iperf3
        image: networkstatic/iperf3:latest
        command: ["iperf3", "-s"]
        ports:
        - containerPort: 5201
        resources:
          requests:
            cpu: "1"
            memory: "1Gi"
          limits:
            cpu: "2"
            memory: "2Gi"
      affinity:
        podAntiAffinity:
          preferredDuringSchedulingIgnoredDuringExecution:
          - weight: 100
            podAffinityTerm:
              labelSelector:
                matchExpressions:
                - key: app
                  operator: In
                  values: ["iperf3-server"]
              topologyKey: kubernetes.io/hostname
---
apiVersion: apps/v1
kind: Deployment
metadata:
  name: iperf3-client
spec:
  replicas: 2
  selector:
    matchLabels:
      app: iperf3-client
  template:
    metadata:
      labels:
        app: iperf3-client
    spec:
      containers:
      - name: iperf3
        image: networkstatic/iperf3:latest
        command: ["sleep", "3600"]
        resources:
          requests:
            cpu: "1"
            memory: "1Gi"
          limits:
            cpu: "2"
            memory: "2Gi"
      affinity:
        podAntiAffinity:
          preferredDuringSchedulingIgnoredDuringExecution:
          - weight: 100
            podAffinityTerm:
              labelSelector:
                matchExpressions:
                - key: app
                  operator: In
                  values: ["iperf3-client"]
              topologyKey: kubernetes.io/hostname
EOF

Actual Test Environment Information Verification

# Check cluster information
kubectl cluster-info

# Check test Pod placement
kubectl get pods -o wide | grep iperf3

# Example output:
# NAME                             IP            NODE            
# iperf3-client-6f4ddb5448-jgx8s   10.42.2.244   agent2
# iperf3-client-6f4ddb5448-kgvl9   10.42.1.222   agent1
# iperf3-server-7df69f9f55-g64fs   10.42.1.221   agent1
# iperf3-server-7df69f9f55-wwgk4   10.42.2.243   agent2

Step 3: Performance Verification (Actual Commands Used)

# Check Pod IPs and names
kubectl get pods -l app=iperf3-server -o jsonpath='{.items[*].status.podIP}'
kubectl get pods -l app=iperf3-client -o jsonpath='{.items[*].metadata.name}'

# Cross-Node TCP single connection test (actual command)
kubectl exec iperf3-client-6f4ddb5448-jgx8s -- iperf3 -c 10.42.1.221 -t 30 -f M

# Cross-Node TCP parallel connection test (actual command)
kubectl exec iperf3-client-6f4ddb5448-jgx8s -- iperf3 -c 10.42.1.221 -t 30 -P 4 -f M

# Same-Node TCP test (actual command)
kubectl exec iperf3-client-6f4ddb5448-jgx8s -- iperf3 -c 10.42.2.243 -t 30 -f M

# UDP stability test (actual command)
kubectl exec iperf3-client-6f4ddb5448-jgx8s -- iperf3 -c 10.42.1.221 -t 30 -u -b 1G

# Automated script for performance comparison
cat > benchmark-test.sh << 'EOF'
#!/bin/bash

echo "=== CNI Performance Benchmark Test ==="
echo "Measurement time: $(date)"

# Collect Pod information
SERVER_IPS=($(kubectl get pods -l app=iperf3-server -o jsonpath='{.items[*].status.podIP}'))
CLIENT_PODS=($(kubectl get pods -l app=iperf3-client -o jsonpath='{.items[*].metadata.name}'))

echo "Server Pod IPs: ${SERVER_IPS[@]}"
echo "Client Pods: ${CLIENT_PODS[@]}"

# Cross-Node tests
echo "=== Cross-Node TCP Single Connection ==="
kubectl exec ${CLIENT_PODS[0]} -- iperf3 -c ${SERVER_IPS[0]} -t 30 -f M

echo "=== Cross-Node TCP Parallel Connection ==="
kubectl exec ${CLIENT_PODS[0]} -- iperf3 -c ${SERVER_IPS[0]} -t 30 -P 4 -f M

echo "=== Cross-Node UDP Test ==="
kubectl exec ${CLIENT_PODS[0]} -- iperf3 -c ${SERVER_IPS[0]} -t 30 -u -b 1G

# Same-Node tests
echo "=== Same-Node TCP Single Connection ==="
kubectl exec ${CLIENT_PODS[0]} -- iperf3 -c ${SERVER_IPS[1]} -t 30 -f M

echo "=== Same-Node TCP Parallel Connection ==="
kubectl exec ${CLIENT_PODS[0]} -- iperf3 -c ${SERVER_IPS[1]} -t 30 -P 4 -f M
EOF

chmod +x benchmark-test.sh
./benchmark-test.sh

Step 4: Result Analysis and Verification

# Expected results (Cilium baseline)
# Cross-Node TCP single: ~54.6 Gbps
# Cross-Node TCP parallel: ~36.0 Gbps
# Same-Node TCP single: ~77.0 Gbps
# Same-Node TCP parallel: ~84.2 Gbps
# UDP packet loss rate: 0%

# Verify performance improvement over Canal
echo "Expected performance improvement over Canal:"
echo "- Cross-Node TCP single: 271% improvement (14.72 Gbps โ†’ 54.64 Gbps)"
echo "- Same-Node TCP single: 76% improvement (43.68 Gbps โ†’ 77.04 Gbps)"
echo "- UDP stability: Perfect transmission (0% packet loss)"

Business Impact and ROI Analysis

Performance Improvement Effects

Throughput Increase

  • Cross-Node communication: 271% improvement
  • Same-Node communication: 76% improvement
  • Stability: Complete elimination of UDP packet loss

Resource Efficiency

  • Up to 3x network performance improvement with same hardware
  • eBPF-based CPU usage optimization
  • Reduced memory usage

Cost Reduction Effects

Infrastructure Efficiency

  • Maximized utilization of existing hardware
  • Delayed scale-out due to resolved network bottlenecks

Operational Costs

  • Minimized network-related failures through packet loss elimination
  • Reduced job completion time due to high performance

Conclusions

This benchmark results clearly demonstrate through actual measurement data that Cilium shows overwhelming performance advantages over Canal. Particularly, the 271% performance improvement in Cross-Node communication (14.72 Gbps โ†’ 54.64 Gbps) and perfect UDP stability (0.024% loss โ†’ 0% loss) can be game-changers for data-centric workloads.

Key Messages Based on Actual Measurements:

  • ๐Ÿš€ Performance: 54.64 Gbps vs 14.72 Gbps in Cross-Node communication (3.7x improvement)
  • ๐Ÿ›ก๏ธ Stability: 0 vs 32-506 packet losses (perfect data integrity)
  • ๐Ÿ’ฐ Efficiency: 85% retransmission reduction (6719 โ†’ 1014 times) maximizing CPU efficiency
  • ๐Ÿ”ฎ Future-oriented: Continuous development of eBPF ecosystem

Specific Business Impact:

  • 100GB data transfer: 54 seconds โ†’ 15 seconds (72% time reduction)
  • Distributed learning parameter synchronization: 5.4 seconds โ†’ 1.5 seconds (3.6x efficiency)
  • Network stability: Zero data loss through perfect packet transmission

For organizations where data workload performance is critical, it's time to actively consider migrating to Cilium based on the actually measured 271% performance improvement. Particularly in environments running AI/ML, big data processing, and distributed databases, these performance improvements will directly translate to business value.

๐Ÿ’ก Action Recommendation: Use the actual test scripts and measurement methodologies provided in this blog to verify the same performance improvements in your environment. You'll be able to directly confirm the overwhelming performance differences shown by actual measurement data.

References

Subscribe to PAASUP IDEAS

Donโ€™t miss out on the latest issues. Sign up now to get access to the library of members-only issues.
jamie@example.com
Subscribe