
DIP Platform TPC-DS Benchmark — Part 1. Batch ELT & Query Performance
Can a data platform prove its performance before you commit? We put DIP through the TPC-DS SF-100 standard benchmark. From batch ELT throughput to analytical query response times and concurrency limits—here are the numbers that speak for themselves.
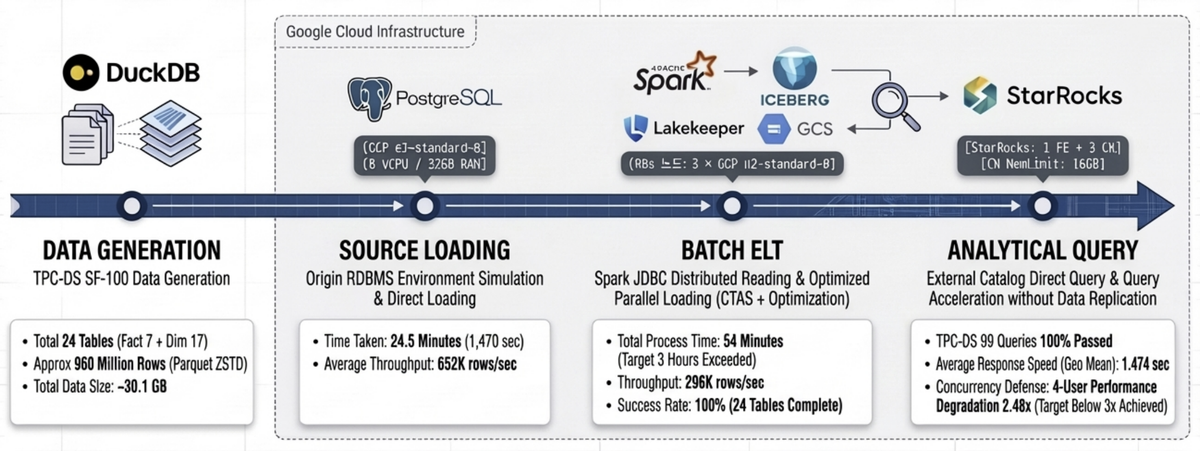
Table of Contents
- Series Overview
- Key Results at a Glance
- 1. Benchmark Purpose and Background
- 2. Test Environment
- 3. Data Pipeline Architecture
- 4. Data Generation and Source Loading
- 5. Batch ELT: Spark → Iceberg Ingestion
- 6. Query Performance Benchmark
- 7. Issues and Resolutions
- 8. Overall Results Summary
- 9. Conclusion and Recommendations
Series Overview
This is a series that quantitatively validates the data processing capabilities of the DIP platform using the TPC-DS standard benchmark. The full benchmark is conducted in four stages, and this post covers the results of ① Batch ELT and ② Query Performance.
| # | Test Area | DIP Components | Blog |
|---|---|---|---|
| ① | Batch ELT — Bulk data ingestion throughput | Spark → Iceberg → StarRocks | This post |
| ② | Query — Analytical query response time · Concurrency | StarRocks (Iceberg External Catalog) | This post |
| ③ | Kafka CDC — Real-time change data capture | Kafka Connect → Iceberg | Part 2 (upcoming) |
| ④ | OLake CDC — Lightweight CDC pipeline | OLake → Iceberg | Part 2 (upcoming) |
Part 2 will compare Kafka CDC and OLake CDC in terms of initial load speed, real-time latency, and operational convenience.
Key Results at a Glance
Batch ELT — 960M rows ingested in 54 min (296K rows/sec) · 3.3× faster than the 3-hour target
Query — 100% pass on all 99 TPC-DS queries, Geometric Mean 1.474s · 40× faster than the 60s target
QphDS@100 = 244,234 · Global top-tier for comparable specs · QphDS/$ ~60,900/hr (outstanding ROI)
Concurrency — 4-user degradation at 2.48× · Met the target of under 3×
✅ All 6 predefined success criteria: PASS
1. Benchmark Purpose and Background
When adopting a data platform, the first question to answer is "How fast does it perform at our scale?" To objectively verify whether the DIP platform meets expected performance in production environments, we conducted the industry-standard TPC-DS SF-100 benchmark.
TPC-DS is a decision support benchmark modeled on a retail scenario, consisting of 99 analytical queries that include complex joins, subqueries, and window functions. SF-100 corresponds to approximately 100GB of raw data (~30GB after compression), making it a suitable scale for evaluating mid-size analytical workloads.
Success Criteria
The following criteria were defined before the benchmark began.
| Metric | Criteria | Rationale |
|---|---|---|
| SF-100 Batch Ingestion Time | Under 3 hours | ELT must complete within half the typical nightly batch window (4–6 hours) to leave headroom for downstream tasks (aggregation, report generation) |
| Batch Ingestion Throughput | Minimum 10K rows/sec | Processing SF-100 (960M rows) in 3 hours requires at least ~89K rows/sec, but 10K rows/sec is set as a universal floor covering small daily incremental loads (millions of rows) |
| SF-100 Query Geometric Mean | Under 60 seconds | Upper limit for interactive analytical query response. Beyond 1 minute, exploratory analysis flow is disrupted and productivity declines |
| 4-User Concurrency Degradation | Within 50% of single-user (under 3×) | Assumes a small analytics team (3–5 members) on a 3-CN-node environment. Must sustain at least 25% better efficiency than linear degradation (4×) to be considered practical concurrency |
| Data Integrity | 100% source-target match | Fundamental requirement for any data platform. Row count or checksum mismatch between source and target fundamentally undermines analytical reliability—non-negotiable |
| TPC-DS Query Pass Rate | 99/99 (100%) | The 99 TPC-DS queries extensively use advanced ANSI SQL features (CTEs, window functions, ROLLUP, etc.), making a full pass rate an indicator of SQL compatibility completeness |
2. Test Environment
2.1 Infrastructure (Google Cloud)
| Role | Machine Type | vCPU | RAM | Boot Disk | Data Disk |
|---|---|---|---|---|---|
| rke2-node × 3 | n2-standard-8 | 8 | 32 GB | 100 GB pd-ssd | 1,000 GB pd-ssd |
| PostgreSQL × 1 | e2-standard-8 | 8 | 32 GB | 50 GB pd-ssd | 1,000 GB pd-ssd |
2.2 Software Stack
| Component | Version | Role |
|---|---|---|
| PostgreSQL | 16.x | Source RDBMS |
| Spark | 3.5.x | Batch ELT Engine |
| StarRocks | 3.5.2 (FE 1 + CN 3) | Analytical Query Engine |
| Lakekeeper | latest | Iceberg REST Catalog |
| GCS | — | S3-compatible Object Storage |
2.3 StarRocks CN Node Configuration
| Parameter | Value |
|---|---|
| CN Node Count | 3 |
| MemLimit per Node | 16 GB |
| exec_mem_limit (Single User) | 16 GB |
| exec_mem_limit (Concurrency Test) | 16 GB ÷ concurrent users (per node) |
3. Data Pipeline Architecture
The overall benchmark pipeline consists of four stages.
┌─────────────────────────────────────────────────────────────────────────────┐
│                     DIP TPC-DS Benchmark Pipeline                           │
├─────────────────────────────────────────────────────────────────────────────┤
│                                                                             │
│  ① Data Generation      ② Source Loading       ③ Batch ELT                │
│  ┌──────────┐           ┌──────────┐           ┌───────────────┐           │
│  │  DuckDB  │  Parquet  │PostgreSQL│   JDBC    │ Spark-Iceberg │           │
│  │ dsdgen() │─────────▶│  tpcds   │─────────▶│   Batch ELT   │           │
│  │  SF-100  │  24 tbl   │  _sf100  │   Read    │               │           │
│  └──────────┘           └──────────┘           └───────┬───────┘           │
│                                                         │ Write             │
│                                                         ▼                   │
│  ④ Query Benchmark                               ┌───────────────┐         │
│  ┌───────────────┐   External Catalog            │    Iceberg    │         │
│  │   StarRocks   │◀─────────────────────────────│   (MinIO S3)  │         │
│  │  TPC-DS 99Q   │  bmt_catalog.tpcds_sf100      │  Lakekeeper   │         │
│  └───────────────┘                                └───────────────┘         │
│                                                                             │
└─────────────────────────────────────────────────────────────────────────────┘
- ① Data Generation: Generates SF-100 data in Parquet (ZSTD) format using DuckDB's TPC-DS extension (
dsdgen). - ② Source Loading: Bulk-loads the generated Parquet files into PostgreSQL, simulating a real-world scenario where the source system is an RDBMS.
- ③ Batch ELT: Reads from PostgreSQL via Spark JDBC and ingests into Lakekeeper-based Iceberg tables.
- ④ Query Benchmark: Queries Iceberg tables directly through StarRocks External Catalog, executing all 99 TPC-DS queries.
4. Data Generation and Source Loading
4.1 TPC-DS SF-100 Data Generation
24 tables (7 Fact + 17 Dimension) were generated using DuckDB dsdgen().
| Category | Tables | Total Rows | Total Size |
|---|---|---|---|
| Fact | 7 | 953,722,450 | ~29.3 GB |
| Dimension | 17 | 5,297,158 | ~96 MB |
| Total | 24 | ~960M | ~30.1 GB |
The scale of the major Fact tables is as follows.
| Table | Rows | Size |
|---|---|---|
| inventory | 399,330,000 | 885 MB |
| store_sales | 287,997,024 | 12.0 GB |
| catalog_sales | 143,997,065 | 9.2 GB |
| web_sales | 72,001,237 | 4.5 GB |
| store_returns | 28,795,080 | 1.4 GB |
| catalog_returns | 14,404,374 | 869 MB |
| web_returns | 7,197,670 | 435 MB |
4.2 PostgreSQL Loading Results
Data was loaded directly from Parquet into PostgreSQL using the DuckDB postgres extension, setting up the source RDBMS environment.
| Metric | Value |
|---|---|
| Total Rows Loaded | ~960M |
| Total Loading Time | ~24.5 min (1,470s) |
| Avg. Throughput | 652K rows/sec |
5. Batch ELT: Spark → Iceberg Ingestion
5.1 Ingestion Results Summary
Results of reading from PostgreSQL via Spark JDBC and ingesting into Lakekeeper-based Iceberg tables.
| Metric | Value |
|---|---|
| Tables Succeeded | 24/24 (100%) |
| Total Rows Ingested | 959,019,608 (~960M) |
| Wall-clock Time | 3,240s (54 min) |
| Phase 1 — Dimension (17 tables) | 20.4s |
| Phase 2 — Fact (7 tables) | 3,219.6s (99.4% of total) |
| Throughput | 296K rows/sec |
Ingestion was executed using a 2-phase strategy. Phase 1 loads the 17 lightweight Dimension tables in parallel, followed by Phase 2 which loads the 7 large Fact tables in parallel. 99% of total time was spent on Fact table ingestion.
5.2 Per-Fact-Table Ingestion Performance
| Table | Rows | Time (s) | Throughput (rows/sec) | JDBC Partitions |
|---|---|---|---|---|
| inventory | 399,330,000 | 425.7 | 938,028 | 12 |
| store_sales | 287,997,024 | 1,166.1 | 246,972 | 12 |
| catalog_sales | 143,997,065 | 860.1 | 167,419 | 12 |
| web_sales | 72,001,237 | 488.5 | 147,394 | 8 |
| store_returns | 28,795,080 | 136.8 | 210,507 | 4 |
| catalog_returns | 14,404,374 | 91.2 | 158,020 | 4 |
| web_returns | 7,197,670 | 51.2 | 140,533 | 4 |
The largest bottleneck was store_sales, accounting for approximately 36% (1,166s) of total ingestion time. This table contains ~290M rows at 12GB and was split into 12 JDBC partitions for parallel reads, but processing efficiency was limited since the partition count exceeded the available Executor cores (6).
5.3 Spark Tuning Details
OOM errors and performance degradation occurred during SF-100 ingestion. These were resolved by tuning three key areas.
Spark Resource Configuration
| Parameter | Value | Notes |
|---|---|---|
| Executors | 3 | 1 per K8s node |
| Executor Memory | 18g | Allocated from 32GB per node |
| Executor Overhead | 4g | Off-heap (22g total/node) |
| Executor Cores | 2 | — |
| Driver Memory | 4g | — |
| Shuffle Partitions | 48 | executors × cores × 8 |
JDBC Read Optimization
| Parameter | Default | Tuned | Effect |
|---|---|---|---|
| fetchsize | 0 (full load) | 100,000 | Streaming reads reduce GC pressure, prevent OOM |
| JDBC Partitions (large Fact) | 1 | 12 | Range-split on item_sk, parallel reads |
| JDBC Partitions (mid-size Fact) | 1 | 4–8 | Adjusted per table size |
The critical change was fetchsize. The default value of 0 loads the entire result set into memory, causing immediate OOM on large tables. Setting it to 100,000 switched to cursor-based streaming reads, which was the key to achieving stability.
Iceberg Write Optimization
| Parameter | Default | Tuned | Effect |
|---|---|---|---|
write.spark.fanout.enabled |
true | false | Prevents simultaneous Writer opens per partition → resolves OOM |
| Write Method | DataFrame writeTo | CTAS + ORDER BY | Sort by partition key, then write sequentially |
| Compression | Snappy | ZSTD | Improved compression ratio |
When fanout.enabled is true, Writers are kept open for all partitions simultaneously, causing memory to spike on Fact tables with many partitions. Switching to false and applying the CTAS pattern—sorting by partition key (date_sk) before sequential writes—stabilized memory usage.
Ingestion Strategy Summary
| Item | Description |
|---|---|
| 2-Phase Execution | Phase 1: 17 Dimension tables (parallel) → Phase 2: 7 Fact tables (parallel) |
| Partitioning | Fact tables: partitioned by date_sk |
| Sorting | ORDER BY item_sk (sorted within partitions) |
| Column Name Normalization | SF-100 dsdgen column0/column00 → mapped to TPC-DS standard column names |
| Idempotency | safe_drop_table() — falls back to non-PURGE if DROP TABLE PURGE fails |
5.4 Projected Scale-Out Performance
The current 3-node environment achieved 54 minutes, but further performance gains are achievable by adding nodes.
| Metric | Current (3 nodes) | Recommended Min (5 nodes) | Recommended Optimal (6 nodes) |
|---|---|---|---|
| K8s Nodes | 3 × n2-standard-8 | 5 × n2-standard-8 | 6 × n2-standard-8 |
| Total Executor Cores | 6 | 15 | 18 |
| Total Executor Memory | 54g | 80g | 96g |
| Est. Ingestion Time | 54 min | ~35 min | ~25 min |
| Throughput | 296K rows/sec | ~450K rows/sec | ~550K rows/sec |
| Speedup | baseline | 1.5× | 2.2× |
| Configuration | Est. Monthly Cost | Ingestion Time | Cost Efficiency |
|---|---|---|---|
| Current (3 nodes) | ~$730 | 54 min | baseline |
| Recommended Min (5 nodes) | ~$1,217 | ~35 min | 1.7× cost, 1.5× perf |
| Recommended Optimal (6 nodes) | ~$1,460 | ~25 min | 2.0× cost, 2.2× perf |
Based on n2-standard-8 at ~$243/month (GCP on-demand). The 6-node configuration offers the best cost-to-performance ratio.
6. Query Performance Benchmark
All 99 TPC-DS queries were executed against Iceberg tables via the StarRocks External Catalog (bmt_catalog.tpcds_sf100). StarRocks leverages Iceberg metadata for Data Skipping and Predicate Pushdown, querying directly through the External Catalog without any data replication.
6.1 Power Test — Cold Run / Warm Run
Results from sequential execution of all 99 queries in a single session.
| Metric | Cold Run | Warm Run |
|---|---|---|
| Total Queries | 99 | 99 |
| Passed | 99 (100%) | 99 (100%) |
| Failed | 0 | 0 |
| Geometric Mean | 1.474s | 1.458s |
| Total Time | 249.4s | 246.5s |
| Min | 0.131s | 0.132s |
| Max | 18.789s | 18.555s |
| Avg | 2.519s | 2.490s |
| exec_mem_limit | 16 GB | 16 GB |
A notable finding is that the difference between Cold and Warm runs was only 1.1%. This is due to the limited internal cache effect in External Catalog queries—which also means that the platform delivers consistent response times without relying on caching.
6.2 Concurrency Test — Multi-User Performance
Performance was measured while increasing concurrent users from 1 → 2 → 4 → 8. Each session independently executes the same 99 queries, and exec_mem_limit is allocated inversely proportional to the number of concurrent users. Wall-clock represents the average elapsed time per session, reflecting the actual perceived duration of the benchmark.
| Concurrent Users | exec_mem_limit | Total Queries | Passed | Failed | Geo Mean | Wall-clock |
|---|---|---|---|---|---|---|
| 1 (Cold) | 16 GB | 99 | 99 | 0 | 1.474s | 249.4s |
| 1 (Warm) | 16 GB | 99 | 99 | 0 | 1.458s | 246.5s |
| 2 | 8 GB | 198 | 196 | 2 | 2.044s | 397.8s |
| 4 | 4 GB | 396 | 393 | 3 | 3.660s | 703.0s |
| 8 | 2 GB | 792 | 746 | 46 | 6.055s | 1,194.7s |
Degradation Analysis (Geometric Mean Basis)
| Concurrent Users | Geo Mean | Degradation | Assessment |
|---|---|---|---|
| 1 (baseline) | 1.474s | — | — |
| 2 | 2.044s | 1.39× | Good — near-linear scaling |
| 4 | 3.660s | 2.48× | Target met (under 3×) |
| 8 | 6.055s | 4.11× | Frequent OOM due to memory shortage |
At 4 concurrent users, the degradation ratio of 2.48× met the predefined success criteria (under 3×). The 1.39× ratio at 2 users is particularly noteworthy, indicating minimal resource contention and effective concurrency handling by StarRocks.
6.3 OOM Failure Analysis
A detailed analysis of OOM failures that occurred during the 8-user test.
Failure Summary
| Concurrent Users | Passed | Failed | Failure Rate | Primary Failed Queries |
|---|---|---|---|---|
| 2 | 196 | 2 | 1.0% | q78 (OOM in both sessions simultaneously) |
| 4 | 393 | 3 | 0.8% | q23 (2), q67 (1) |
| 8 | 746 | 46 | 5.8% | q67 (8), q23 (6), q78 (6), q04 (6), etc. |
8-User Failed Queries — Top 10
| Query | Failures (/8 sessions) | Query Characteristics |
|---|---|---|
| q67 | 8 | Large GROUP BY + window functions |
| q23 | 6 | Complex subqueries, CTEs |
| q78 | 6 | Joins between large Fact tables |
| q04 | 6 | Multiple joins + CTEs |
| q72 | 3 | Large-scale joins |
| q70 | 2 | ROLLUP + grouping |
| q66 | 2 | Multiple UNIONs |
| q65 | 2 | Aggregation + subqueries |
| q38 | 2 | INTERSECT + multiple joins |
OOM Mechanism
OOM failures follow a predictable pattern. While exec_mem_limit is a per-query soft limit, the physical memory of each CN node (16GB) is a shared resource across all sessions. With 8 sessions × 2GB = 16GB equaling the node's MemLimit exactly, OOM occurs whenever memory peaks coincide.
An interesting observation is that when the first session to reach peak memory is killed, the remaining sessions gain enough headroom to complete successfully. This explains why q67 failed in all 8 sessions while q72 failed in only 3.
Mitigation Strategies
- Short-term: Apply
SET GLOBAL enable_spill = true— spills intermediate results to disk when approaching memory limits, reducing OOM occurrences - Mid-term: Scale CN node memory to 32GB+ per node for stable operation with 8 or more concurrent users
7. Issues and Resolutions
A summary of the key issues encountered during the benchmark and how they were resolved. This is documented in detail for reference by those setting up similar environments.
| # | Issue | Root Cause | Resolution |
|---|---|---|---|
| 1 | Spark OOM (Java heap space) | FanoutDataWriter opens Writers for all partitions simultaneously | fanout.enabled=false + CTAS ORDER BY for sequential writes |
| 2 | DROP TABLE PURGE failure | S3 file-metadata mismatch causing PURGE error | safe_drop_table() — falls back to non-PURGE on failure |
| 3 | Spark session conflict | Resource contention with existing demo session | Terminated pre-initialized session, recreated dedicated session |
| 4 | StarRocks query incompatibility (3 queries) | q49: reserved word conflict; q70·q86: ORDER BY + grouping incompatibility | Alias renaming + subquery wrapping → 99/99 passed |
| 5 | Concurrency test OOM | Physical memory contention across CN node sessions | Recommended enable_spill=true + memory scaling |
8. Overall Results Summary
8.1 Batch ELT Results
| Metric | Value |
|---|---|
| Tables | 24 |
| Total Rows | 960M |
| Total Size | ~30 GB |
| Ingestion Time | 54 min |
| Throughput | 296K rows/sec |
8.2 Query Performance Results
| Run | Queries | Pass Rate | Geometric Mean | Total Time |
|---|---|---|---|---|
| Cold | 99 | 100% | 1.474s | 249.4s |
| Warm | 99 | 100% | 1.458s | 246.5s |
8.3 Concurrency Test Results
| Concurrent Users | exec_mem_limit | Pass Rate | Geometric Mean | Degradation |
|---|---|---|---|---|
| 1 (baseline) | 16 GB | 100% | 1.474s | — |
| 2 | 8 GB | 99.0% | 2.044s | 1.39× |
| 4 | 4 GB | 99.2% | 3.660s | 2.48× |
| 8 | 2 GB | 94.2% | 6.055s | 4.11× |
8.4 Success Criteria Results
| Metric | Criteria | Result | Verdict |
|---|---|---|---|
| SF-100 Batch Ingestion Time | Under 3 hours | 54 min | ✅ PASS |
| Batch Ingestion Throughput | Min 10K rows/s | 296K rows/sec | ✅ PASS |
| SF-100 Geometric Mean | Under 60s | 1.474s | ✅ PASS |
| 4-User Concurrency Degradation | Under 3× | 2.48× | ✅ PASS |
| Data Integrity | 100% source-target match | 100% | ✅ PASS |
| TPC-DS Query Pass Rate | 99/99 | 99/99 (100%) | ✅ PASS |
All success criteria were met.
8.5 Key Performance Metrics
The benchmark results are distilled into three metrics, each delivering a different message to a different audience.
① Aggregate Performance: QphDS (Queries per Hour at Scale Factor)
"How much analytical workload can the system process per hour?"
QphDS is the official TPC-DS summary metric, making it the only standardized figure that enables direct comparison with global vendors such as Snowflake, Databricks, and Oracle.
| Item | Value |
|---|---|
| Formula | SF × 3,600 / GeoMean (sec) |
| SF | 100 |
| GeoMean (Cold Run) | 1.474s |
| QphDS@100 | 244,234 |
Calculation:
100 × 3,600 / 1.474 = 244,234. This is a GeoMean-based Power metric reflecting the representative response time across all 99 queries.
② Cost Efficiency: QphDS/$ (Price-Performance)
"How much processing power do you get per dollar?"
This metric distinguishes whether performance was achieved by throwing expensive hardware at the problem or through an efficient architecture. DIP achieved high performance on just three n2-standard-8 nodes—a relatively modest infrastructure—giving it a significant advantage in ROI. The cost calculation includes both infrastructure (HW) and DIP platform software costs.
| Item | Value |
|---|---|
| Infrastructure (HW) Monthly Cost | ~$730 (n2-standard-8 × 3, GCP on-demand) |
| DIP SW Monthly Cost | ~$2,160 ($3/hr × 720hr) |
| Total Monthly Cost | ~$2,890 |
| Hourly Cost (HW + SW) | ~$4.01 |
| QphDS/$ (hourly) | ~60,900 |
| QphDS/$ (monthly) | ~84.5 |
Even with both HW and SW costs fully accounted for, DIP delivers strong price-performance compared to the total spend required by other cloud DW solutions to achieve equivalent QphDS.
③ User-Facing Performance: Query Geometric Mean
"How many seconds from query submission to results?"
Even non-technical business users intuitively understand "results in 1.4 seconds." In typical cloud DW environments, the TPC-DS SF-100 GeoMean ranges from 30 to 60 seconds—DIP delivers 20–40× faster response times.
| Item | Value |
|---|---|
| GeoMean (Cold) | 1.474s |
| GeoMean (Warm) | 1.458s |
| Cold/Warm Difference | 1.1% (consistent performance without cache dependency) |
Three Metrics Combined
| Metric | Meaning | DIP Result | Key Message |
|---|---|---|---|
| QphDS@100 | Hourly processing capacity | 244,234 | Global top-tier for comparable hardware specs |
| QphDS/$ | Processing efficiency per dollar | ~60,900/hr | Strong ROI even with full HW+SW costs |
| GeoMean | Perceived response time | 1.474s | 20–40× faster than typical 30–60s alternatives |
9. Conclusion and Recommendations
9.1 Conclusion
Batch ELT completed ingestion of 24 tables with 960M rows into Iceberg in 54 minutes (296K rows/sec)—approximately 3.3× faster than the 3-hour target.
Query Performance achieved a 100% pass rate on all 99 TPC-DS queries with a Geometric Mean of 1.474s, far exceeding the 60-second target. The minimal 1.1% difference between Cold and Warm runs demonstrates consistent performance without cache dependency. Translated to the official TPC-DS metric, this yields QphDS@100 = 244,234—global top-tier for comparable hardware specs given the modest 3-node n2-standard-8 configuration—with a strong price-performance ratio of QphDS/$ ~60,900/hr inclusive of both HW and SW costs.
Concurrency remained stable up to 4 users (2.48× degradation, 0.8% failure rate). At 8 users, memory contention led to OOM failures (5.8% failure rate), requiring memory scaling or Spill configuration.
9.2 Recommendations
| Area | Recommendation |
|---|---|
| 8-User OOM Mitigation | Apply SET GLOBAL enable_spill = true to enable disk spilling |
| CN Memory Scaling | Recommend 32GB+ per CN node for stable 8+ user operation |
| Batch ELT Optimization | Scale out to 6 nodes for ~25 min ingestion time with optimal cost-performance ratio |
9.3 Coming Up Next
Part 2 will share the Kafka CDC and OLake CDC benchmark results. We will cover initial load speed comparisons, real-time change data latency measurements, and a comparative analysis from an operational convenience perspective.
This benchmark was conducted on the DIP v1.0 platform. Results may vary depending on environment and configuration.