
DIP Platform TPC-DS Benchmark — Part 2. Real-Time CDC Performance Comparison
Benchmarking three PostgreSQL → Iceberg CDC pathways against 960 million records. In terms of balancing pipeline simplicity with real-time processing, Flink CDC emerges as the most compelling option. Initial load can be supplemented with a hybrid strategy combining Spark Batch.
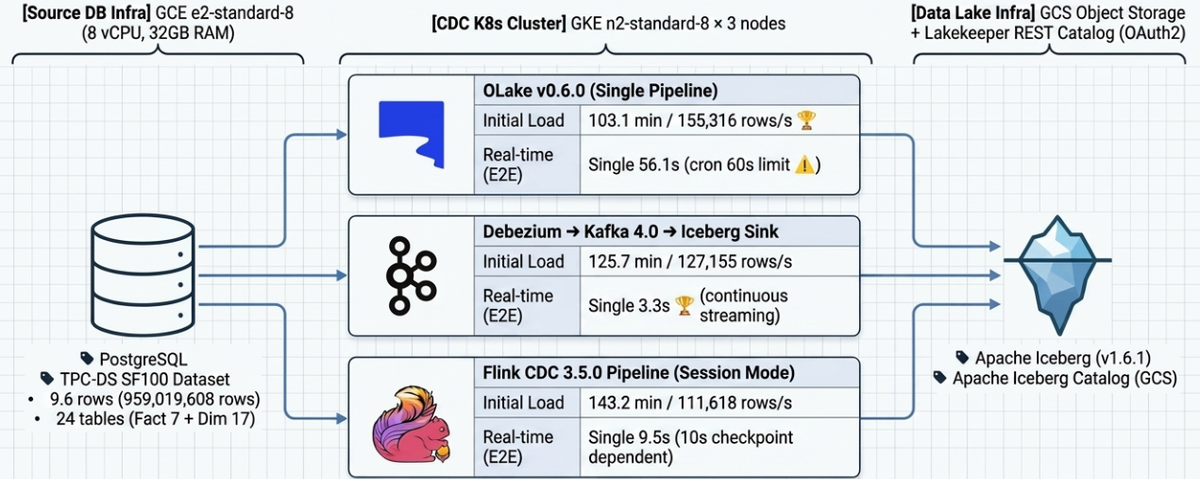
Table of Contents
- Overview
- Results Summary
- System Architecture
- Path A: OLake
- Path B: Kafka CDC (Debezium)
- Path C: Flink CDC Pipeline
- Initial Load Comparison
- Real-Time CDC Comparison
- Path-Specific Constraints & Characteristics
- Production Environment Recommendations
1. Overview
1.1 Purpose
Building on the previous blog post (Part 1: Batch ELT & Query Performance), this document benchmarks and analyzes the performance of loading the TPC-DS SF-100 dataset (~960M rows) stored in PostgreSQL into Iceberg tables via three CDC paths (Initial Load). It also measures real-time change propagation (E2E Latency, Throughput) after the initial load completes, evaluating the operational suitability of each path.
| Path | Technology Stack |
|---|---|
| Path A | PostgreSQL → OLake v0.6.0 → Iceberg |
| Path B | PostgreSQL → Debezium Source → Kafka → Iceberg Sink → Iceberg |
| Path C | PostgreSQL → Flink 3.5.0 CDC Pipeline → Iceberg |
1.2 Target Dataset
| Item | Value |
|---|---|
| Dataset | TPC-DS Scale Factor 100 |
| PostgreSQL Schema | tpcds_sf100 |
| Total Tables | 24 (7 Fact + 17 Dimension) |
| Total Record Count | 959,019,608 (~960M) |
Row count by table:
| Table | Row Count | Job Category |
|---|---|---|
| inventory | 399,330,000 | fact2 |
| store_sales | 287,997,024 | fact1 |
| catalog_sales | 143,997,065 | fact3 |
| web_sales | 72,001,237 | fact3 |
| store_returns | 28,795,080 | fact3 |
| catalog_returns | 14,404,374 | fact3 |
| web_returns | 7,197,670 | fact3 |
| customer | 1,981,703 | dim |
| customer_demographics | 1,920,800 | dim |
| customer_address | 1,000,000 | dim |
| Other 14 Dimension tables | ~390,000 | dim |
1.3 Job Partitioning
All three paths are split into 4 jobs under identical conditions for a fair comparison:
| Job | Scope | Row Count |
|---|---|---|
| dim | 17 Dimension tables | ~5.3M |
| fact1 | store_sales | 287,997,024 |
| fact2 | inventory | 399,330,000 |
| fact3 | catalog_sales, web_sales, store_returns, catalog_returns, web_returns | 266,395,426 |
Note: For Path C (Flink CDC), given the dataset size, fact2 targets catalog_sales and inventory is included in fact3.
2. Results Summary
Initial Load (960M rows, TPC-DS SF-100)
| Path | Technology Stack | Wall-clock | Throughput | Notes |
|---|---|---|---|---|
| Path A (OLake) | OLake v0.6.0 → Iceberg | 103.1 min | 155,316 rows/s | 🥇 Fastest |
| Path B (Kafka CDC) | Debezium → Kafka → Iceberg | 125.7 min | 127,155 rows/s | |
| Path C (Flink CDC) | Flink CDC Pipeline → Iceberg | 143.2 min | 111,618 rows/s | PK required, Equality Delete occurs |
Real-Time CDC (E2E Latency)
| Test | Path A | Path B | Path C | Notes |
|---|---|---|---|---|
| Single Row (10 rows) | 56.1s | 3.3s | 9.5s | Path A: cron 60s ceiling |
| Burst 1M | 64.4s | 34.8s | 45.3s | |
| Sustained 100rps × 10 min | 19.6s | 40.2s | 13.8s | |
| Mixed DML (I/U/D) | 36.6s | 3.5s | 4.8s | |
| Peak Load | 47.8s | 17.7s | 10.6s | |
| Schema Evolution | 14.9s | TIMEOUT ❌ | TIMEOUT ❌ | Path B/C both fail |
| Recovery | 51.2s | 5.6s | 157.2s | Path C: includes job restart |
One-Line Summary
- Initial load speed: Path A > Path B > Path C
- Real-time CDC latency: Path B (streaming, ~3s) > Path C (checkpoint, ~10s) > Path A (cron, ~60s)
- Operational simplicity: Path C (session-cluster job management, Dashboard UI) > Path B (complex operational management) > Path A (difficult resource management)
- Production recommendation: Hybrid strategy combining Spark Batch for initial load with Path B or Path C for incremental CDC (→ see Section 10)
3. System Architecture
3.1 Infrastructure
| Component | Spec |
|---|---|
| PostgreSQL | GCE e2-standard-8 (8 vCPU, 32GB RAM) |
| Kubernetes | GKE n2-standard-8 × 3 (8 vCPU, 32GB RAM) |
| Iceberg Catalog | Lakekeeper REST Catalog (OAuth2 via Keycloak) |
| Object Storage | GCS (S3-compatible endpoint) |
| Benchmark Client | JupyterLab (PySpark + psycopg2) |
3.2 Software Versions
| Software | Version |
|---|---|
| Apache Iceberg | 1.6.1 |
| Apache Spark (validation) | 3.5.2 |
| Kafka | 4.0.0 (KRaft) |
| Debezium PostgreSQL Connector | 2.x |
| Iceberg Sink Connector | 1.6.1 |
| OLake | v0.6.0 |
| Flink CDC | 3.5.0 (Pipeline mode) |
| Flink | 1.20.1 |
3.3 Initial Load Data Flow
Path A (OLake):
  PostgreSQL ──(CTID-split parallel export)──▶ OLake Worker ──▶ Iceberg (GCS)

Path B (Kafka CDC):
  PostgreSQL ──(Full table sequential export)──▶ Kafka 24 Topics ──(Iceberg Sink, 8 tasks)──▶ Iceberg (GCS)

Path C (Flink CDC):
  PostgreSQL ──(PK chunk-split parallel export)──▶ Flink CDC Pipeline ──▶ Iceberg (GCS)
Path C requires a PK on the PostgreSQL source tables.
4. Path A: OLake
4.1 Environment Configuration
| Item | Setting |
|---|---|
| OLake Version | v0.6.0 |
| Deployment | K8s Pod (4 Jobs, 4 Replication Slots) |
| Resources/Pod | 4 cores / 10GB memory |
| Max Threads | 3 (OOM prevention) |
| Snapshot Method | CTID range-based auto chunk split (262,144 units) |
| Iceberg Catalog | Lakekeeper REST (OAuth2) |
4.2 Initial Load Results
| Job | Tables | Row Count | Duration | Throughput |
|---|---|---|---|---|
| olake-dim | 17 Dimension tables | 7,065,369 | 3.4 min | 34,465 rows/s |
| olake-fact1 | store_sales | 287,997,024 | 86.2 min | 55,662 rows/s |
| olake-fact2 | inventory | 399,330,000 | 39.4 min | 169,136 rows/s |
| olake-fact3 | 5 Fact tables | 266,395,426 | 103.1 min | 43,071 rows/s |
fact3 table detail:
| Table | Row Count | rows/s |
|---|---|---|
| catalog_sales | 143,997,065 | 35,669 |
| web_sales | 72,001,237 | 31,089 |
| store_returns | 28,795,080 | 51,146 |
| catalog_returns | 14,404,374 | 21,183 |
| web_returns | 7,197,670 | 15,579 |
Wall-clock (dim+fact2 sequential, fact1/fact3 concurrent):
Timeline:
  dim    [=]                                      3.4 min
  fact2  [===========]                           39.4 min
  fact1  [==========================]            86.2 min
  fact3  [===============================]      103.1 min (bottleneck)
         0    20    40    60    80   100   min
| Item | Value |
|---|---|
| Wall-clock | 103.1 min |
| Total rows | 959,019,608 |
| Throughput | 155,316 rows/s |
4.3 Tuning History
| Round | Configuration | Result | Notes |
|---|---|---|---|
| 1st | Single job (24 tables, max_threads=8) | 153.4 min, 104,185 rows/s | store_sales bottleneck (64 min alone) |
| 2nd | 4-job split (same node) | FAILED | Node overload → node stop |
| 3rd | 4-job split + distributed nodes (cordon) + max_threads=3 | 103.1 min, 155,316 rows/s | ✅ Final result |
Root cause of OOM: Memory ≈ chunk_size × column_count × row_size × max_threads + Iceberg Writer buffer. With fixed chunk size (262,144) and no Pod resource configuration (UI/API unsupported), OOM was mitigated by lowering max_threads.
4.4 Real-Time CDC Results
OLake operates in micro-batch (crontab schedule) mode (frequency: * * * * * = every minute). E2E latency includes up to 60 seconds of cron wait time.
| ID | Test | Row Count | E2E Latency | Result |
|---|---|---|---|---|
| R-04 | Single Row | 10 | avg 56.1s (min 24.5s) | PASS |
| R-05 | Burst 1M | 1,000,000 | 64.4s | PASS |
| R-06 | Sustained 10 min | 60,001 | 19.6s | PASS |
| R-07 | Mixed DML | 10,000 | 36.6s | PASS |
| R-08 | Peak Load | 600,000 | 47.8s | PASS |
| R-09 | Schema Evolution | 200 | 14.9s | PASS |
| R-10 | Recovery | 2,000 | 51.2s | PASS |
The dominant factor in E2E latency is the cron wait time (up to 60s); actual CDC processing is estimated to complete within a few seconds.
5. Path B: Kafka CDC (Debezium)
5.1 Environment Configuration
| Component | Spec |
|---|---|
| Kafka Broker | 3 nodes (Strimzi on K8s, Kafka 4.0 KRaft) |
| Kafka Connect | 3 replicas, 4 vCPU / 6GB Memory (JVM -Xmx 4g) |
| Source Connector | 4 (Debezium PostgreSQL), tasksMax=1 |
| Sink Connector | 1 (Iceberg), tasksMax=8 |
| Snapshot Method | Full table sequential scan (once) |
Transform pipeline (Source):
Debezium Raw Message
  → [1] unwrap (ExtractNewRecordState)   # Remove envelope, reduce message size 50–70%
  → [2] addTable (InsertField)           # Add _table field (dynamic routing)
  → [3] route1, route2 (RegexRouter)    # underscore → hyphen
5.2 Initial Load Tuning History
| Round | Issue | Action | Result |
|---|---|---|---|
| 1st | Connect OOM | Resource increase (4Gi→6Gi, JVM 4g) | FAIL → resolved |
| 2nd | Debezium envelope written as-is to Iceberg | Added unwrap SMT, schemas.enable=true | FAIL → resolved |
| 3rd | Produce bottleneck | Scale out Connect 1→3 nodes, commit 60s, increase batch | PARTIAL |
| 4th | Producer default config ceiling | lz4 compression, batch.size 256KB, buffer 64MB | SUCCESS |
Final key configuration changes:
| Item | Before | After |
|---|---|---|
| Producer compression | None | lz4 |
| Producer batch.size | 16KB | 256KB |
| Producer buffer.memory | Default | 64MB |
| Sink commit.interval-ms | 300,000ms (5 min) | 60,000ms (1 min) |
| Message format | Debezium envelope (full) | Flat record (unwrap) |
| Message size | ~1–2 KB/row | ~300–500 bytes/row |
5.3 Initial Load Results
| Job | Tables | Row Count | Duration | Throughput |
|---|---|---|---|---|
| source-dim | 17 Dimension tables | ~6M | ~1.0 min | — |
| source-fact1 | store_sales | 287,997,024 | 102.6 min | 46,767 rows/s |
| source-fact2 | inventory | 399,330,000 | 62.3 min | 106,789 rows/s |
| source-fact3 | 5 Fact tables | 266,395,426 | 125.7 min | 35,300 rows/s |
Wall-clock:
Timeline:
  dim    [=]                                             1.0 min
  fact2  [==================]                           62.3 min
  fact1  [================================]            102.6 min
  fact3  [========================================]    125.7 min (bottleneck)
         0    20    40    60    80   100   120   min
| Item | Value |
|---|---|
| Wall-clock | 125.7 min |
| Total rows | 959,019,608 |
| Throughput | 127,155 rows/s |
5.4 Real-Time CDC Results
commit.interval-ms: 1000 (1s), offset.flush.interval.ms: 1000 (cluster level).
| ID | Test | Row Count | E2E Latency | Result |
|---|---|---|---|---|
| R-04 | Single Row | 10 | avg 3.3s | PASS |
| R-05 | Burst 1M | 1,000,000 | 34.8s (~38,500 rows/s) | PASS |
| R-06 | Sustained 10 min | 60,001 | 40.2s | PASS |
| R-07 | Mixed DML | 10,000 | 3.5s | PASS |
| R-08 | Peak Load | 600,000 | 17.7s | PASS |
| R-09 | Schema Evolution | 200 | - | FAIL |
| R-10 | Recovery | 2,000 | 5.6s | PASS |
Issues encountered:
offset.flush.interval.msdefault (60s) took precedence over commit interval → E2E improved from 60s to 3s after changing to 1s- Auto-create tables in Upsert mode had no identifier set, causing commit failures → switched to Append mode
- Sink tasksMax=3 caused unstable commit coordination → changed to tasksMax=1
6. Path C: Flink CDC Pipeline
6.0 Flink CDC + Iceberg Architecture Characteristics
Pipeline Simplification
The traditional CDC pipeline (DB → Debezium → Kafka → Flink/Spark → Data Lake) is simplified to a single DB → Flink CDC → Iceberg pipeline. Real-time synchronization is possible without an intermediate message queue (Kafka), though the benefits of Kafka's buffering and reprocessing are foregone.
Checkpoint-Based Iceberg Commit
Flink processing (in-memory state)
  → Checkpoint complete
  → Iceberg new snapshot created (metadata commit)
  → Queryable by external engines (Spark, Trino, etc.)
No data is committed to Iceberg until a checkpoint completes.
- Checkpoint interval = data visibility delay (initial load: 60s, real-time CDC: 10s)
- On checkpoint failure, data for that interval is not reflected → job restart required
Upsert / Delete Handling — Merge-On-Read (MOR)
Existing record → Equality Delete file (logical delete marking)
New value       → New Data file (INSERT)
format-version: 2+write.upsert.enabled: truerequired- CTAS compaction needed after initial load to remove Delete files (→ see 6.5)
6.1 Environment Configuration (Session Mode)
| Item | Setting |
|---|---|
| Version | Flink CDC 3.5.0, Flink 1.20.1 |
| Deployment | Flink Kubernetes Operator (Session Mode, distributed) |
| Snapshot Method | PK-based incremental snapshot (chunk.size=100,000) |
| Job Submission | JM pod shell (./bin/flink-cdc.sh) |
| Checkpoint | Automatic (stored on GCS, state.checkpoints.dir) |
Resources:
| Component | CPU | Memory | Count |
|---|---|---|---|
| JobManager | 1 core | 4 GB | 1 |
| TaskManager | 2 cores | 8 GB | 4 |
| Total Slots | — | — | 16 |
Slot allocation:
| Job | Tables | Parallelism | Slots |
|---|---|---|---|
| flink-cdc-dim | 17 Dimension tables | 2 | 2 |
| flink-cdc-fact1 | store_sales | 4 | 4 |
| flink-cdc-fact2 | catalog_sales | 4 | 4 |
| flink-cdc-fact3 | web_sales, inventory, store_returns, catalog_returns, web_returns | 6 | 6 |
| Total | 16 |
6.2 Key Issues and Resolutions
| Issue | Cause | Resolution |
|---|---|---|
| TPC-DS tables lack PKs | Original TPC-DS schema | Added PKs to all 24 tables |
| GCS SSL certificate error | flink-gs-fs-hadoop SDK's own HTTP client — JVM truststore not applied |
Replaced with new image (flink-cdc-pipeline) with built-in GCS dependency |
| Checkpoint not triggering automatically | Flink CDC 3.5.0 potential issue — enableCheckpointing() not called |
Confirmed working in new image |
| OOM (initial) | Memory accumulation due to no checkpointing | Resolved by fixing checkpoint behavior |
6.3 PostgreSQL PK Column Order Change
Due to Flink CDC's PK range query behavior, if the first PK column doesn't align with physical storage order, random I/O is maximized.
| Table | Before | After | Effect |
|---|---|---|---|
| store_sales | (ss_item_sk, ss_ticket_number) | (ss_ticket_number, ss_item_sk) | 54s → 2s per chunk (27× faster) |
| catalog_sales | (cs_item_sk, cs_order_number) | (cs_order_number, cs_item_sk) | |
| web_sales | (ws_item_sk, ws_order_number) | (ws_order_number, ws_item_sk) | 1.6× improvement |
6.4 Initial Load Results
| Job | Tables | Row Count | Duration (est.) | Throughput (est.) |
|---|---|---|---|---|
| dim | 17 Dimension tables | 5,297,158 | 3.4 min | 25,966 rows/s |
| fact1 | store_sales | 287,997,024 | 142.6 min | 33,660 rows/s |
| fact2 | catalog_sales | 143,997,065 | 140.6 min | 17,075 rows/s |
| fact3 | web_sales, inventory, store_returns, catalog_returns, web_returns | 521,728,361 | 113.6 min | 76,533 rows/s |
fact3 table processing order (estimated):
| Table | Duration | Throughput |
|---|---|---|
| inventory (399M, 4 cols) | 39.9 min | ~166,672 rows/s |
| web_sales (72M, 34 cols) | 46.0 min | 26,111 rows/s |
| store_returns (29M, 20 cols) | 13.9 min | 34,532 rows/s |
| catalog_returns (14M, 27 cols) | 9.5 min | 25,312 rows/s |
| web_returns (7M, 24 cols) | 4.4 min | 27,519 rows/s |
Wall-clock:
Timeline:
  fact3  [=================================]  113.6 min
  fact2  [=========================================]  140.6 min
  fact1  [==========================================]  142.6 min (bottleneck)
         0       30      60      90     120     143  min
| Item | Value |
|---|---|
| Wall-clock | 143.2 min |
| Total rows | 959,019,608 |
| Throughput | 111,618 rows/s |
6.5 Post-Processing and Maintenance
Removing Equality Deletes (once, after initial load)
rewrite_data_files does not fully remove equality deletes (Iceberg #12838). CTAS-based recreation is required.
⚠️ CTAS Warning: CTAS does not preserve the source table's partition spec, sort order, or table properties (
write.format.default,write.upsert.enabled, etc.). For partitioned tables, always runSHOW CREATE TABLEbefore CTAS, and reapply the same properties afterward.
spark.conf.set("spark.sql.adaptive.enabled", "true")
spark.conf.set("spark.sql.files.maxRecordsPerFile", "1000000")  # Limit records per file (OOM prevention)

# CTAS → count validation → RENAME → DROP
spark.sql("CREATE TABLE ns.store_sales_clean AS SELECT * FROM ns.store_sales")

# Count validation
orig = spark.table("ns.store_sales").count()
clean = spark.table("ns.store_sales_clean").count()
assert orig == clean, f"Count mismatch: {orig} vs {clean}"

spark.sql("ALTER TABLE ns.store_sales RENAME TO ns.store_sales_old")
spark.sql("ALTER TABLE ns.store_sales_clean RENAME TO ns.store_sales")
spark.sql("DROP TABLE ns.store_sales_old")
Small Files Problem and Regular Compaction
In CDC environments, small data files and Delete files accumulate with each checkpoint.
- Impact: Increased file count → bloated Iceberg metadata → query performance degradation
- Mitigation: Regular merging via Spark
RewriteDataFiles
# Periodic Iceberg compaction (Spark)
spark.sql("""
    CALL catalog.system.rewrite_data_files(
        table => 'namespace.table_name',
        options => map('target-file-size-bytes', '536870912')  -- 512MB
    )
""")
Snapshot Expiration and Orphan File Cleanup (Regular Maintenance)
Iceberg snapshots accumulate with each checkpoint, consuming storage.
from datetime import datetime, timedelta

# Expire old snapshots (older than 7 days, dynamically computed)
cutoff = (datetime.utcnow() - timedelta(days=7)).strftime('%Y-%m-%d %H:%M:%S')
spark.sql(f"""
    CALL catalog.system.expire_snapshots(
        table => 'namespace.table_name',
        older_than => TIMESTAMP '{cutoff}'
    )
""")

# Clean up unreferenced orphan files
spark.sql("""
    CALL catalog.system.remove_orphan_files(
        table => 'namespace.table_name'
    )
""")
| Maintenance Task | Recommended Frequency | Description |
|---|---|---|
rewrite_data_files |
Daily | Merge small files, consolidate Delete files |
expire_snapshots |
Weekly | Remove old snapshot metadata |
remove_orphan_files |
Monthly | Remove data files with broken references |
6.6 Real-Time CDC Results
Test environment:
- Job:
flink-cdc-benchmark(cdc_benchmark, cdc_schema_evolution tables) - Checkpoint interval: 10s / Mode: EXACTLY_ONCE
schema.change.behavior: LENIENT (switched from EVOLVE due to anomalous behavior; works correctly)- Measurement tool:
cdc/cdc_benchmark.ipynb
Test Results
| ID | Test | Row Count | E2E Latency | Result | Notes |
|---|---|---|---|---|---|
| R-04 | Single Row Latency | 10 | avg 9.5s (min 6.0 / max 10.8) | ⚠️ | 10s checkpoint ceiling |
| R-05 | Burst Insert (1M) | 1,000,000 | 45.3s | ✅ | PG: 101,630 rows/s |
| R-06 | Sustained Load (100rps×10 min) | 60,001 | 13.8s | ✅ | Exactly 100 rps maintained |
| R-07 | Mixed DML (I70/U20/D10%) | 10,000 | 4.8s | ✅ | DELETE reflection confirmed |
| R-08 | Peak Load | 600,000 | 10.6s | ✅ | peak 3,000 rps (plateau) |
| R-09 | Schema Evolution | 200 | TIMEOUT (120s) | ❌ | EVOLVE anomaly, workaround via LENIENT |
| R-10 | Recovery Test | 2,000 | 157.2s | ✅ | Includes job restart, consistency OK |
R-09 Schema Evolution failure cause:
On ALTER TABLE ADD COLUMN:
SchemaCoordinator: CreateTableEvent(6 cols) → mistakenly judged "redundant" → schema change events []
IcebergWriter: attempts to write 6-col data with 4-col schema → IndexOutOfBoundsException
Anomalous behavior confirmed in EVOLVE mode. LENIENT mode works but new columns are not reflected. Correct procedure: flink stop (savepoint) → DDL → restart from savepoint.
7. Initial Load Comparison
7.1 Wall-clock and Throughput
| Path | Method | Wall-clock | Throughput | Bottleneck |
|---|---|---|---|---|
| A (OLake) | OLake Worker → Iceberg | 103.1 min | 155,316 rows/s | fact3 |
| B (Kafka CDC) | Debezium → Kafka → Iceberg | 125.7 min | 127,155 rows/s | fact3 |
| C (Flink CDC) | Flink CDC Pipeline (Session Mode) | 143.2 min | 111,618 rows/s | fact1 |
7.2 Per-Job Throughput Comparison
Path C has a different job layout than Paths A/B: fact2=catalog_sales, fact3=web_sales+inventory+store_returns+catalog_returns+web_returns
| Table | Path A | Path B | Path C |
|---|---|---|---|
| dim (17 tables, 5.3M) | 34,465 rows/s | — | 25,966 rows/s |
| store_sales (288M) | 55,662 rows/s | 46,767 rows/s | 33,660 rows/s |
| catalog_sales (144M) | 35,669 rows/s | 35,300 rows/s* | 17,075 rows/s |
| inventory (399M) | 169,136 rows/s | 106,789 rows/s | ~166,672 rows/s (est.) |
*Path B fact3 includes catalog_sales. Path C fact3 throughput (76,533 rows/s) is the aggregate of 5 tables.
7.3 Snapshot Strategy Comparison — Initial Load Method Differences
The three paths differ fundamentally in how they read PostgreSQL data during initial load, which is the primary driver of performance differences.
| Path A (OLake) | Path B (Debezium) | Path C (Flink CDC) | |
|---|---|---|---|
| Snapshot method | CTID-based chunking | Full table scan (once) | PK range query (N times) |
| PK required | No | No | Yes |
| I/O pattern | Sequential (physical block order) | Sequential | Random (PK order dependent) |
| PG query count | Tens to hundreds | 1 | Tens to hundreds |
| Parallelism | Yes (per-chunk workers) | No (single query) | Yes (per PK range) |
| Transaction | Short per-chunk transactions | One long transaction | Short per-chunk transactions |
Path C (Flink CDC) — PK Range Query (DBlog algorithm)
SELECT * FROM table WHERE pk >= chunk_start AND pk < chunk_end
- PK required: snapshot and WAL change log are matched and merged by PK
- PK index → data page access → potential random I/O
- Performance greatly improves when the first PK column's physical storage order is aligned (→ see 6.3)
Path C initial load performance inferiority analysis:
| Factor | Impact |
|---|---|
| PK range query vs sequential scan | Random I/O overhead |
| Synchronous pipeline (Source→Schema→Sink sequential) | Disadvantaged vs asynchronous Kafka buffer |
| Equality delete double-write | 20–40% write overhead |
8. Real-Time CDC Comparison
| ID | Test | Path A E2E | Path B E2E | Path C E2E | Notes |
|---|---|---|---|---|---|
| R-04 | Single Row (10 rows) | 56.1s | 3.3s | 9.5s ⚠️ | Path C: 10s checkpoint ceiling |
| R-05 | Burst 1M | 64.4s | 34.8s | 45.3s | |
| R-06 | Sustained 100rps × 10 min | 19.6s | 40.2s | 13.8s | Path C: favors high-throughput checkpoint |
| R-07 | Mixed DML (I/U/D) | 36.6s | 3.5s | 4.8s | Path C: DELETE properly reflected |
| R-08 | Peak Load | 47.8s | 17.7s | 10.6s | Path C: peak 3,000 rps |
| R-09 | Schema Evolution | 14.9s | TIMEOUT ❌ | TIMEOUT ❌ | Paths B and C both fail (→ see Sections 5, 6) |
| R-10 | Recovery | 51.2s | 5.6s | 157.2s* | *Includes job restart, consistency OK |
Path characteristics:
- Path A: Micro-batch (cron) architecture → minimum E2E latency of 60s. Near-realtime not achievable.
- Path B: Continuous streaming → single-row E2E ~3s, large change volumes reflected within tens of seconds. Most stable.
- Path C: Checkpoint interval = E2E latency floor. With 10s setting, R-04 ~9.5s. Shortening checkpoint improves latency. R-08/R-06 outperform Path B.
9. Path-Specific Constraints & Characteristics
| Item | Path A (OLake) | Path B (Kafka CDC) | Path C (Flink CDC) |
|---|---|---|---|
| Initial load speed | ★★★★★ | ★★★★ | ★★★★ |
| Real-time CDC latency | ★★ (cron-bound) | ★★★★★ | ★★★ (checkpoint-bound) |
| PK required | No | No | Yes |
| Parallelism control | max_threads defined | source tasks=1 | Defined in Pipeline |
| Initial load write mode | Append selectable | Append selectable | Upsert forced (hardcoded) |
| Equality delete | None | None | Always occurs → CTAS needed |
| Intermediate layer | None | Kafka (buffer, reprocessing) | None |
| Failure recovery | Job restart | Kafka offset-based | Checkpoint + Replication Slot |
| Schema evolution | ✅ Automatic | ❌ TIMEOUT (→ see Section 5) | ❌ TIMEOUT → workaround via LENIENT |
| Pod resource control | ❌ UI/API unsupported | ✅ Direct K8s config | ✅ FlinkDeployment CR |
10. Production Environment Recommendations
Transitioning from initial load to incremental CDC without data loss is the most challenging phase of any CDC implementation. This section compares two strategies and presents the recommended approach for production environments.
10.1 Strategy Comparison — Hybrid vs CDC Only
CDC Only Strategy
Both initial load and incremental changes are handled by the same CDC tool (OLake / Debezium / Flink CDC).
[Initial Load]    PostgreSQL ──(CDC Snapshot)──▶ Iceberg
[Incremental CDC] PostgreSQL ──(CDC WAL)──────▶ Iceberg
Advantages:
- Simplified pipeline with a single tool
- Snapshot → WAL transition is handled automatically within the tool
Limitations and risks:
| Item | Problem |
|---|---|
| Initial load speed | Path A 103 min, Path B 126 min, Path C 143 min — all limited by single-threaded or constrained parallelism |
| Replication Slot occupation | WAL continuously accumulates during initial load → risk of disk usage spike |
| Equality Delete accumulation | Path C (Flink CDC) forces Upsert throughout initial load → large volume of Delete files |
| Job redeployment required for initial → incremental transition | Initial load (Snapshot) and incremental CDC (WAL) require different resource configurations and settings, making it difficult to run continuously with the same job. After initial load, the job must be stopped, resource and settings adjusted for incremental CDC, and redeployed. For example, Path A requires adjusting max_threads and Path C requires parallelism and chunk.size, introducing a downtime window and risk of data loss on misconfiguration. |
Hybrid Strategy (Spark Batch + CDC Incremental)
A role-separation strategy where initial load is handled at high speed by Spark Batch, with CDC responsible only for incremental changes.
[Initial Load]    PostgreSQL ──(Spark JDBC Bulk Read)──▶ Iceberg  (Append Only)
[Incremental CDC] PostgreSQL ──(CDC WAL)──────────────▶ Iceberg  (Upsert/Delete)
                                          ↑
                        Replication Slot created before initial load starts
Core principle: Create the Replication Slot before the initial load begins, so that WAL changes occurring during the Spark Batch run are picked up by CDC afterward, eliminating any risk of data loss.
Comprehensive Strategy Comparison
| Item | CDC Only | Hybrid (Recommended) |
|---|---|---|
| Initial load speed | ★★★ (limited CDC parallelism) | ★★★★★ (Spark parallel JDBC) |
| Iceberg file quality | ⚠️ Heavy Equality Delete generation (Path C) | ✅ Append Only → excellent file quality |
| Large-scale data suitability | ★★★ | ★★★★★ |
Based on this benchmark (960M rows), Spark JDBC Bulk Read is expected to deliver 2–3× faster initial load performance compared to CDC Snapshot.