
DIP Platform TPC-DS 1 TB Benchmark
Benchmarking the DIP platform at TPC-DS SF-1000 (1 TB, 6.3B rows): Batch ELT at 1,451K rows/sec, StarRocks query GeoMean of 2.2s, CN scaling analysis, and Trino comparison — all on S3 object storage.
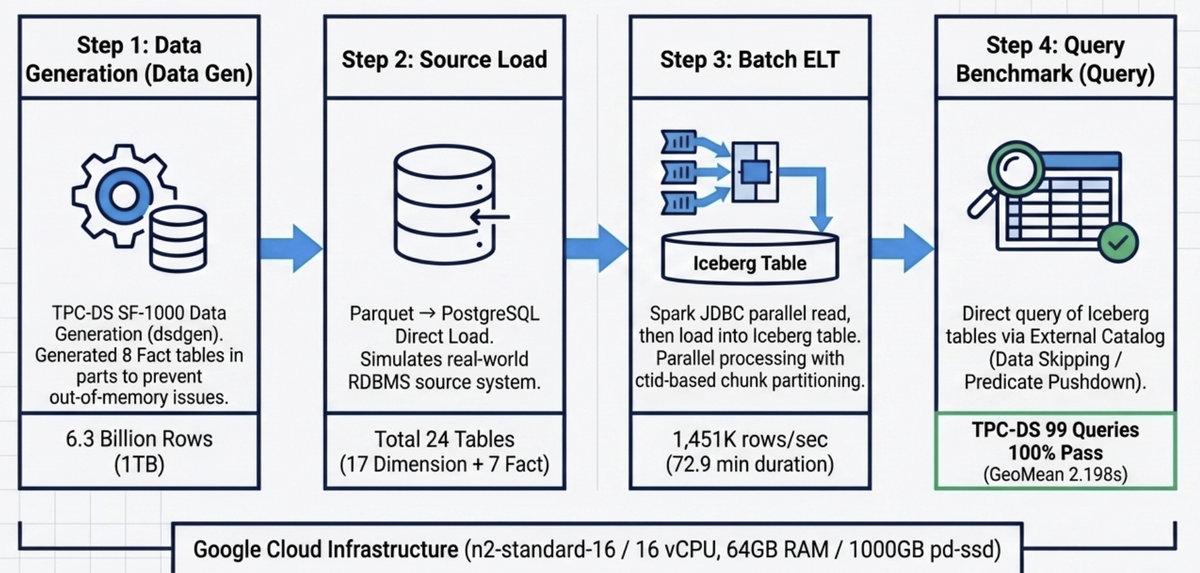
Table of Contents
- Introduction
- Key Results Summary
- 1. Benchmark Purpose and Background
- 2. Test Environment
- 3. Data Pipeline Architecture
- 4. Data Generation and Source Loading
- 5. Batch ELT: Spark → Iceberg Loading
- 6. Query Performance Benchmark
- 7. Iceberg Partition Strategy Comparison
- 8. Issues and Resolutions
- 9. Full Results Summary
- 10. Conclusions and Recommendations
Introduction
This is part of a series that quantitatively validates the data processing capabilities of the DIP platform using the TPC-DS standard benchmark. In the previous installment (Part 1-1), we validated Batch ELT and query performance at SF-100 (100 GB) scale. This post scales up 10× to SF-1000 (1 TB) to re-validate ingestion performance and query response times in a large-scale data environment.
| # | Test Area | Scale | Post |
|---|---|---|---|
| ① | Batch ELT + Query (SF-100) | 960M rows / 30 GB | Part 1-1 |
| ② | Batch ELT + Query (SF-1000) | 6.3B rows / 1 TB | This post |
Key Results Summary
Batch ELT — 6.3B rows loaded in ~73 min (1,451K rows/sec) · 4.9× throughput improvement vs. SF-100
Query — 100% pass rate on all 99 TPC-DS queries, Geometric Mean 2.198s (CN4 Warm) · 3.1× faster than Trino
QphDS@1000 = 1,637,853 · Global competitiveness confirmed even on S3 Object Storage
CN Scaling — CN3→CN5 expansion yields 44.8% improvement in Warm Total; CN4 is the optimal cost-performance balance point
vs. Trino — Faster on 97 of 99 queries, up to 63× faster on complex queries
1. Benchmark Purpose and Background
While the SF-100 benchmark validated DIP platform performance, real enterprise environments typically handle analytical workloads in the hundreds of GB to multi-TB range. TPC-DS SF-1000 (1 TB) covers approximately 6.3 billion rows and is an appropriate scale for evaluating medium-to-large analytical workload performance.
The objectives of this benchmark are as follows:
- Large-scale ingestion validation: Confirm Batch ELT pipeline throughput for loading 6.3B rows into Iceberg
- Query response time validation: Measure response times for all 99 TPC-DS queries at SF-1000 scale
- CN node scaling effects: Quantify performance changes across CN3/CN4/CN5 configurations
- External comparison: Performance comparison against Trino
2. Test Environment
2.1 Infrastructure (Google Cloud)
| Component | Machine Type | vCPU | RAM | Boot Disk | Data Disk |
|---|---|---|---|---|---|
| rke2-node × 5 | n2-standard-16 | 16 | 64 GB | 200 GB pd-ssd | 1,000 GB pd-ssd |
| PostgreSQL × 1 | e2-standard-16 | 16 | 64 GB | 50 GB pd-ssd | 1,000 GB pd-ssd |
2.2 Software Stack
| Component | Version | Role |
|---|---|---|
| PostgreSQL | 16.x | Source RDBMS |
| Spark | 3.5.x | Batch ELT engine |
| StarRocks | 4.0.8 (FE 1 + CN 3~5) | Analytical query engine |
| Lakekeeper | latest | Iceberg REST Catalog |
| GCS | — | S3-compatible object storage |
| DuckDB | — | Data generation & Parquet → PostgreSQL loading |
2.3 StarRocks CN Node Configuration
| Item | Value |
|---|---|
| CN node count | 3~5 (scaling test) |
| vCPU per node | 15 cores |
| MemLimit per node | 50.859 GiB |
be.conf mem_limit |
90% |
3. Data Pipeline Architecture
The full benchmark pipeline consists of four stages:
┌──────────────────────────────────────────────────────────────────────────────┐
│                    DIP TPC-DS SF-1000 Benchmark Pipeline                     │
├──────────────────────────────────────────────────────────────────────────────┤
│                                                                              │
│  ① Data Generation      ② Source Load          ③ Batch ELT                 │
│  ┌───────────┐          ┌───────────┐           ┌───────────────┐           │
│  │  DuckDB   │ Parquet  │PostgreSQL │   JDBC    │ Spark-Iceberg │           │
│  │  dsdgen() │────────▶│  tpcds    │─────────▶│   Batch ELT   │           │
│  │  SF-1000  │ 24 tbl   │ _sf1000   │ ctid-based│               │           │
│  │ (8 splits)│          └───────────┘ chunk read└───────┬───────┘           │
│  └───────────┘                                           │ Write             │
│                                                           ▼                   │
│  ④ Query Benchmark                              ┌───────────────┐           │
│  ┌───────────────┐   External Catalog           │    Iceberg    │           │
│  │   StarRocks   │◀──────────────────────────── │   (GCS)       │           │
│  │  TPC-DS 99Q   │  bmt_catalog.tpcds_sf1000    │  Lakekeeper   │           │
│  └───────────────┘                               └───────────────┘           │
│                                                                              │
└──────────────────────────────────────────────────────────────────────────────┘
- ① Data Generation: SF-1000 data is generated using DuckDB's TPC-DS extension (
dsdgen). Fact tables are split into 8 parts during generation to prevent OOM, then converted to Parquet (ZSTD). - ② Source Load: Parquet files are loaded from DuckDB into PostgreSQL, reproducing a scenario where the source system is an RDBMS.
- ③ Batch ELT: PostgreSQL is read via Spark JDBC and loaded into Iceberg tables backed by Lakekeeper. A ctid-based chunk-split parallel read approach is used to eliminate I/O bottlenecks.
- ④ Query Benchmark: StarRocks External Catalog queries Iceberg tables directly, executing all 99 TPC-DS queries.
4. Data Generation and Source Loading
4.1 TPC-DS SF-1000 Data Generation
Using DuckDB dsdgen(), 24 tables (7 Fact + 17 Dimension) were generated. SF-1000 is approximately 10× larger than SF-100.
| Category | Tables | Total Rows | Notes |
|---|---|---|---|
| Fact | 7 | 6,326,962,833 | Generated in 8 splits |
| Dimension | 17 | 20,313,689 | — |
| Total | 24 | 6,347,276,522 (~6.3B) | ~1 TB |
Key Fact table sizes:
| Table | Rows | vs. SF-100 |
|---|---|---|
| store_sales | 2,879,987,999 | ×10.0 |
| catalog_sales | 1,439,980,416 | ×10.0 |
| inventory | 783,000,000 | ×2.0 |
| web_sales | 720,000,376 | ×10.0 |
| store_returns | 287,999,764 | ×10.0 |
| catalog_returns | 143,996,756 | ×10.0 |
| web_returns | 71,997,522 | ×10.0 |
4.2 PostgreSQL Load Results
Split Parquet files were loaded directly into PostgreSQL using the DuckDB postgres extension.
| Item | Value |
|---|---|
| DuckDB memory_limit | 40 GB |
| DuckDB threads | 12 |
| chunk_size | 50,000,000 rows |
| Total tables loaded | 24 (17 Dimension + 7 Fact) |
5. Batch ELT: Spark → Iceberg Loading
5.1 Load Results Summary
Results of reading PostgreSQL via Spark JDBC and loading into Iceberg tables backed by Lakekeeper:
| Item | Value |
|---|---|
| Successful tables | 24/24 (100%) |
| Total rows loaded | 6,347,276,522 (~6.3B) |
| Phase 1 — Dimension (17 tables) | 67.1s |
| Phase 2 — Fact (7 tables) | 4,305.9s (~71.8 min) |
| Wall-clock time | 4,373.0s (72.9 min) |
| Sequential sum | 4,450.7s |
| Concurrency effect | 1.0× |
| Throughput | 1,451K rows/sec |
Throughput improved from 296K rows/sec at SF-100 to 1,451K rows/sec at SF-1000 — approximately 4.9×. This is attributed to the introduction of ctid-based chunk-split parallel reads and a significant increase in JDBC partition count for large tables (up to 240).
Loading was executed in a 2-phase strategy: Phase 1 loads the 17 lightweight Dimension tables in parallel, followed by Phase 2 loading the 7 large Fact tables in parallel. Fact table loading accounts for 98.5% of the total time.
5.2 Fact Table Loading Performance
| Table | Rows | Time (s) | Throughput (rows/s) | Partition Column | ctid_chunks |
|---|---|---|---|---|---|
| store_sales | 2,879,987,999 | 1,824.2 | 1,578,776 | ss_sold_date_sk | 240 |
| catalog_sales | 1,439,980,416 | 1,296.1 | 1,111,044 | cs_sold_date_sk | 240 |
| web_sales | 720,000,376 | 671.6 | 1,072,138 | ws_sold_date_sk | 120 |
| inventory | 783,000,000 | 111.1 | 7,046,857 | inv_date_sk | 72 |
| store_returns | 287,999,764 | 207.1 | 1,390,741 | sr_returned_date_sk | 24 |
| catalog_returns | 143,996,756 | 125.4 | 1,148,081 | cr_returned_date_sk | 24 |
| web_returns | 71,997,522 | 70.5 | 1,021,434 | wr_returned_date_sk | 24 |
The biggest bottleneck was store_sales, taking 1,824s to process ~2.9B rows. With ctid_chunks set to 240 for maximum parallelism, throughput reached 1,578K rows/sec. The inventory table, with only 4 columns, recorded an exceptionally high throughput of 7,046K rows/sec.
5.3 Spark Tuning Details
SF-1000 scale required additional tuning beyond what was needed for SF-100.
ctid-Based Chunk-Split Reads
At SF-100, JDBC reads used ORDER BY on a date column. At SF-1000, applying ORDER BY on date columns over multi-billion-row Fact tables caused PostgreSQL to access the entire heap via random I/O, causing a massive spike in block I/O. This was resolved by switching to ctid (physical row location) range-based chunked sequential reads, which eliminated random I/O and significantly improved speed.
Spark Executor Temp Directory Space
Temporary files generated during large Iceberg writes exceeded the default ephemeral storage limit of Kubernetes executor pods. This was resolved by mounting a dedicated temp directory and explicitly specifying ephemeral storage limits in the Spark configuration:
conf.set("spark.kubernetes.executor.request.ephemeral-storage", "30Gi")
conf.set("spark.kubernetes.executor.limit.ephemeral-storage", "50Gi")
Validation Results
Row count comparison between PostgreSQL and Iceberg confirmed all 24 tables OK — 100% data integrity achieved.
6. Query Performance Benchmark
All 99 TPC-DS queries were executed against Iceberg tables via StarRocks External Catalog (bmt_catalog.tpcds_sf1000). StarRocks performs Data Skipping and Predicate Pushdown using Iceberg metadata, querying directly via External Catalog without any data replication.
6.1 Power Test — Cold Run / Warm Run
Results from 1 Cold + 3 Warm runs on CN4 (4-node) configuration. q78 was run with enable_spill=true due to high Hash Join memory usage; all other queries used enable_spill=false.
| Item | Cold Run | Warm Run (3-run avg) |
|---|---|---|
| Total queries | 99 | 99 |
| Passed | 99 (100%) | 99 (100%) |
| Failed | 0 | 0 |
| Geometric Mean | 4.376s | 2.198s |
| Total Time | 837.7s | 481.1s |
| Min | 0.131s (q41) | 0.134s (q41) |
| Max | 61.4s (q23) | 60.5s (q23) |
| Avg | 8.463s | 4.859s |
| query_mem_limit | 35 GB | 35 GB |
Despite a 10× data increase from SF-100 to SF-1000, response time increased by only 1.49× (GeoMean: 1.474s → 2.198s), demonstrating that StarRocks' MPP architecture and Iceberg partition pruning remain effective at large scale.
The 2× GeoMean difference between Cold and Warm runs (vs. only 1.1% at SF-100) is due to DataCache covering only ~19% of the full ~1 TB dataset, meaning 81% must still be re-read from GCS on Warm runs. The root cause is a low datacache_max_flying_memory_mb setting that bottlenecks disk cache population speed.
6.2 CN Node Scaling Benchmark (CN3 / CN4 / CN5)
Performance was measured by varying the CN node count from 3 → 4 → 5. All configurations ran 1 Cold + 3 Warm runs, with all 99 queries passing.
Overall Summary
| Metric | CN3 | CN4 | CN5 | CN3→CN4 | CN4→CN5 | CN3→CN5 |
|---|---|---|---|---|---|---|
| Cold Total (s) | 892.4 | 837.7 | 474.9 | -6.1% | -43.3% | -46.8% |
| Cold Geo Mean (s) | 3.435 | 4.376 | 2.500 | +27.4% | -42.9% | -27.2% |
| Warm avg Total (s) | 732.0 | 481.1 | 404.0 | -34.3% | -16.0% | -44.8% |
| Warm avg Geo Mean (s) | 2.565 | 2.198 | 2.022 | -14.3% | -8.0% | -21.2% |
| Warm avg Avg (s) | 7.394 | 4.859 | 4.081 | -34.3% | -16.0% | -44.8% |
| Warm avg Max (s) | 164.75 (q67) | 60.52 (q23) | 46.62 (q23) | — | — | — |
Why CN3 Cold GeoMean (3.435) is lower than CN4 (4.376): q67 cold takes 180.8s on CN3, heavily inflating the Total, but most simple queries are faster on CN3 cold. In Warm runs, CN3's CPU/memory limitations become apparent and the rankings reverse.
Scaling Efficiency Analysis
| Range | Node Increase | Ideal Improvement | Actual Improvement (Warm Total) | Efficiency |
|---|---|---|---|---|
| CN3 → CN4 | +33% | 25.0% | +34.3% | 137% (super-linear) |
| CN4 → CN5 | +25% | 20.0% | +16.0% | 80% (diminishing returns) |
| CN3 → CN5 | +67% | 40.0% | +44.8% | 112% |
The super-linear improvement (137%) from CN3→CN4 is because large queries under memory pressure on CN3 (q67: 164s → 43s) normalized on CN4. From CN4→CN5, S3 I/O-bound queries hit a ceiling with the additional node, leading to diminishing returns (80%).
Top 15 Queries by Absolute Improvement CN3→CN5 (warm_avg)
| Query | CN3 | CN4 | CN5 | CN3→CN5 Abs | CN3→CN5 % |
|---|---|---|---|---|---|
| q67 | 164.750 | 42.965 | 33.869 | -130.9s | -79.4% |
| q23 | 93.381 | 60.517 | 46.623 | -46.8s | -50.1% |
| q78 | 60.817 | 47.162 | 32.424 | -28.4s | -46.7% |
| q09 | 32.543 | 24.829 | 20.361 | -12.2s | -37.4% |
| q28 | 20.870 | 14.915 | 12.573 | -8.3s | -39.8% |
| q88 | 20.198 | 14.614 | 12.593 | -7.6s | -37.7% |
| q04 | 18.302 | 13.438 | 11.293 | -7.0s | -38.3% |
| q75 | 16.476 | 13.602 | 10.490 | -6.0s | -36.3% |
| q65 | 15.772 | 12.367 | 9.773 | -6.0s | -38.0% |
| q50 | 15.334 | 12.079 | 9.804 | -5.5s | -36.1% |
| q97 | 13.412 | 10.849 | 8.461 | -5.0s | -36.9% |
| q14 | 13.280 | 10.942 | 8.578 | -4.7s | -35.4% |
| q11 | 10.084 | 7.508 | 6.336 | -3.7s | -37.2% |
| q24 | 10.030 | 7.239 | 6.477 | -3.6s | -35.4% |
| q38 | 6.432 | 5.107 | 4.296 | -2.1s | -33.2% |
Queries Slower on CN5 than CN4 (★, warm_avg, +5% or more)
| Query | CN4 | CN5 | Diff | Characteristic |
|---|---|---|---|---|
| q44 | 8.327 | 10.799 | +29.7% | store_sales full scan + window func |
| q22 | 5.062 | 6.214 | +22.8% | inventory 12-month aggregation |
| q21 | 0.420 | 0.488 | +16.2% | inventory simple join |
| q33 | 1.218 | 1.348 | +10.7% | store_sales + date filter |
| q69 | 1.139 | 1.234 | +8.3% | multi-fact subquery |
| q58 | 0.908 | 0.983 | +8.3% | catalog/store/web 3-way |
| q98 | 0.863 | 0.929 | +7.6% | store_sales date range |
| q77 | 1.095 | 1.176 | +7.4% | multi-fact UNION |
| q68 | 1.007 | 1.076 | +6.9% | store_sales + date |
| q41 | 0.134 | 0.143 | +6.7% | no fact table (item only) |
| q53 | 1.098 | 1.171 | +6.6% | store_sales monthly |
| q42 | 0.400 | 0.423 | +5.7% | store_sales simple |
| q43 | 0.806 | 0.847 | +5.1% | store_sales simple |
These are mostly simple/small queries under 10 seconds where inter-node coordination overhead (network orchestration, distributed planner cost) exceeds actual computation time. The additional CN5 node introduces more coordination overhead that burdens small queries.
q67 Outlier Analysis
| Config | Cold | Warm 1 | Warm 2 | Warm 3 | Warm avg |
|---|---|---|---|---|---|
| CN3 | 180.786 | 165.210 | 163.808 | 165.232 | 164.750 |
| CN4 | 43.278 | 42.335 | 44.067 | 42.494 | 42.965 |
| CN5 | 33.301 | 34.234 | 33.618 | 33.756 | 33.869 |
q67 (store_sales 12-month multi-dimensional rollup) remained stuck at 164s on CN3 even in Warm runs. On CN4 it dropped to 43s (~4×), and further to 34s on CN5. The suspected cause is intermediate result spilling due to insufficient memory on CN3. CN3 is considered unfit for production at SF-1000 scale; CN4 or higher is the minimum recommendation.
Per-Query CN3 / CN4 / CN5 Comparison (Warm avg, in seconds)
★ = CN5 slower than CN4 (warm_avg, +5% or more)
▲ = CN5 improvement vs. CN3 ≥ 50%
| Query | CN3 | CN4 | CN5 | CN3→CN4 | CN4→CN5 | CN3→CN5 | Notes |
|---|---|---|---|---|---|---|---|
| q01 | 1.696 | 1.578 | 1.299 | -7.0% | -17.7% | -23.4% | |
| q02 | 2.735 | 1.999 | 1.757 | -26.9% | -12.1% | -35.8% | |
| q03 | 0.924 | 0.807 | 0.704 | -12.7% | -12.8% | -23.8% | |
| q04 | 18.302 | 13.438 | 11.293 | -26.6% | -16.0% | -38.3% | |
| q05 | 2.259 | 1.846 | 1.832 | -18.3% | -0.8% | -18.9% | |
| q06 | 0.756 | 0.725 | 0.755 | -4.1% | +4.1% | -0.1% | |
| q07 | 2.456 | 1.759 | 1.788 | -28.4% | +1.6% | -27.2% | |
| q08 | 0.720 | 0.744 | 0.741 | +3.3% | -0.4% | +2.9% | |
| q09 | 32.543 | 24.829 | 20.361 | -23.7% | -18.0% | -37.4% | |
| q10 | 1.225 | 1.166 | 1.169 | -4.8% | +0.3% | -4.6% | |
| q11 | 10.084 | 7.508 | 6.336 | -25.6% | -15.6% | -37.2% | |
| q12 | 0.471 | 0.552 | 0.461 | +17.2% | -16.5% | -2.1% | |
| q13 | 3.216 | 2.513 | 2.120 | -21.9% | -15.6% | -34.1% | |
| q14 | 13.280 | 10.942 | 8.578 | -17.6% | -21.6% | -35.4% | |
| q15 | 1.075 | 2.378 | 2.305 | +121.2% | -3.1% | +114.4% | ★ |
| q16 | 1.370 | 1.236 | 1.247 | -9.8% | +0.9% | -9.0% | |
| q17 | 3.130 | 2.583 | 2.115 | -17.5% | -18.1% | -32.4% | |
| q18 | 2.203 | 2.120 | 1.884 | -3.8% | -11.1% | -14.5% | |
| q19 | 0.920 | 0.805 | 0.807 | -12.5% | +0.2% | -12.3% | |
| q20 | 0.491 | 0.481 | 0.487 | -2.0% | +1.2% | -0.8% | |
| q21 | 0.434 | 0.420 | 0.488 | -3.2% | +16.2% | +12.4% | ★ |
| q22 | 6.223 | 5.062 | 6.214 | -18.7% | +22.8% | -0.1% | ★ |
| q23 | 93.381 | 60.517 | 46.623 | -35.2% | -23.0% | -50.1% | ▲ |
| q24 | 10.030 | 7.239 | 6.477 | -27.8% | -10.5% | -35.4% | |
| q25 | 2.471 | 2.067 | 1.805 | -16.4% | -12.7% | -26.9% | |
| q26 | 1.277 | 1.126 | 0.992 | -11.8% | -11.9% | -22.3% | |
| q27 | 1.973 | 1.547 | 1.396 | -21.6% | -9.8% | -29.2% | |
| q28 | 20.870 | 14.915 | 12.573 | -28.5% | -15.7% | -39.8% | |
| q29 | 6.057 | 5.096 | 4.200 | -15.9% | -17.6% | -30.7% | |
| q30 | 1.455 | 1.433 | 1.392 | -1.5% | -2.9% | -4.3% | |
| q31 | 2.465 | 1.990 | 1.857 | -19.3% | -6.7% | -24.7% | |
| q32 | 0.507 | 0.462 | 0.472 | -8.9% | +2.2% | -6.9% | |
| q33 | 1.270 | 1.218 | 1.348 | -4.1% | +10.7% | +6.1% | ★ |
| q34 | 1.237 | 1.042 | 1.058 | -15.8% | +1.5% | -14.5% | |
| q35 | 2.262 | 2.042 | 2.014 | -9.7% | -1.4% | -11.0% | |
| q36 | 2.066 | 1.657 | 1.377 | -19.8% | -16.9% | -33.3% | |
| q37 | 1.792 | 1.444 | 1.272 | -19.4% | -11.9% | -29.0% | |
| q38 | 6.432 | 5.107 | 4.296 | -20.6% | -15.9% | -33.2% | |
| q39 | 0.949 | 0.875 | 0.813 | -7.8% | -7.1% | -14.3% | |
| q40 | 0.710 | 2.371 | 0.800 | +233.9% | -66.3% | +12.7% | |
| q41 | 0.133 | 0.134 | 0.143 | +0.8% | +6.7% | +7.5% | ★ |
| q42 | 0.434 | 0.400 | 0.423 | -7.8% | +5.7% | -2.5% | ★ |
| q43 | 1.105 | 0.806 | 0.847 | -27.1% | +5.1% | -23.3% | ★ |
| q44 | 13.563 | 8.327 | 10.799 | -38.6% | +29.7% | -20.4% | ★ |
| q45 | 1.186 | 1.142 | 1.085 | -3.7% | -5.0% | -8.5% | |
| q46 | 2.161 | 1.765 | 1.663 | -18.3% | -5.8% | -23.0% | |
| q47 | 5.396 | 4.752 | 3.721 | -11.9% | -21.7% | -31.0% | |
| q48 | 2.157 | 1.656 | 1.680 | -23.2% | +1.4% | -22.1% | |
| q49 | 2.591 | 1.953 | 1.829 | -24.6% | -6.3% | -29.4% | |
| q50 | 15.334 | 12.079 | 9.804 | -21.2% | -18.8% | -36.1% | |
| q51 | 8.072 | 6.118 | 4.908 | -24.2% | -19.8% | -39.2% | |
| q52 | 0.434 | 0.420 | 0.437 | -3.2% | +4.0% | +0.7% | |
| q53 | 1.425 | 1.098 | 1.171 | -22.9% | +6.6% | -17.8% | ★ |
| q54 | 1.224 | 1.044 | 1.072 | -14.7% | +2.7% | -12.4% | |
| q55 | 0.430 | 0.419 | 0.407 | -2.6% | -2.9% | -5.3% | |
| q56 | 0.965 | 0.956 | 0.999 | -0.9% | +4.5% | +3.5% | |
| q57 | 3.919 | 3.640 | 2.854 | -7.1% | -21.6% | -27.2% | |
| q58 | 0.979 | 0.908 | 0.983 | -7.3% | +8.3% | +0.4% | ★ |
| q59 | 5.342 | 3.841 | 3.237 | -28.1% | -15.7% | -39.4% | |
| q60 | 1.226 | 1.219 | 1.176 | -0.6% | -3.5% | -4.1% | |
| q61 | 1.652 | 1.574 | 1.464 | -4.7% | -7.0% | -11.4% | |
| q62 | 1.456 | 1.193 | 1.017 | -18.1% | -14.8% | -30.1% | |
| q63 | 1.420 | 1.081 | 1.081 | -23.9% | +0.0% | -23.9% | |
| q64 | 12.278 | 9.353 | 8.643 | -23.8% | -7.6% | -29.6% | |
| q65 | 15.772 | 12.367 | 9.773 | -21.6% | -21.0% | -38.0% | |
| q66 | 1.685 | 1.423 | 1.284 | -15.5% | -9.8% | -23.8% | |
| q67 | 164.750 | 42.965 | 33.869 | -73.9% | -21.2% | -79.4% | ▲ |
| q68 | 1.162 | 1.007 | 1.076 | -13.3% | +6.9% | -7.4% | ★ |
| q69 | 1.223 | 1.139 | 1.234 | -6.9% | +8.3% | +0.9% | ★ |
| q70 | 5.319 | 3.763 | 3.854 | -29.3% | +2.4% | -27.5% | ★ |
| q71 | 2.001 | 1.910 | 1.882 | -4.6% | -1.5% | -5.9% | |
| q72 | 8.816 | 7.998 | 6.291 | -9.3% | -21.3% | -28.6% | |
| q73 | 0.769 | 0.832 | 0.770 | +8.2% | -7.5% | +0.1% | |
| q74 | 8.351 | 6.147 | 5.246 | -26.4% | -14.7% | -37.2% | |
| q75 | 16.476 | 13.602 | 10.490 | -17.4% | -22.9% | -36.3% | |
| q76 | 11.943 | 10.518 | 10.004 | -11.9% | -4.9% | -16.2% | |
| q77 | 1.191 | 1.095 | 1.176 | -8.1% | +7.4% | -1.3% | ★ |
| q78 | 60.817 | 47.162 | 32.424 | -22.4% | -31.3% | -46.7% | |
| q79 | 2.283 | 2.118 | 1.741 | -7.2% | -17.8% | -23.7% | |
| q80 | 5.779 | 4.609 | 4.016 | -20.2% | -12.9% | -30.5% | |
| q81 | 1.560 | 1.453 | 1.420 | -6.9% | -2.3% | -9.0% | |
| q82 | 3.302 | 2.392 | 2.219 | -27.6% | -7.2% | -32.8% | |
| q83 | 0.848 | 0.811 | 0.809 | -4.4% | -0.2% | -4.6% | |
| q84 | 1.299 | 1.268 | 1.239 | -2.4% | -2.3% | -4.6% | |
| q85 | 2.136 | 2.048 | 1.925 | -4.1% | -6.0% | -9.9% | |
| q86 | 1.616 | 1.144 | 1.163 | -29.2% | +1.7% | -28.0% | |
| q87 | 6.678 | 5.091 | 4.505 | -23.8% | -11.5% | -32.5% | |
| q88 | 20.198 | 14.614 | 12.593 | -27.6% | -13.8% | -37.7% | |
| q89 | 1.515 | 1.378 | 1.122 | -9.0% | -18.6% | -25.9% | |
| q90 | 1.567 | 1.298 | 1.218 | -17.2% | -6.2% | -22.3% | |
| q91 | 0.852 | 0.805 | 0.814 | -5.5% | +1.1% | -4.5% | |
| q92 | 0.437 | 0.400 | 0.411 | -8.5% | +2.7% | -5.9% | |
| q93 | 8.565 | 6.319 | 5.448 | -26.2% | -13.8% | -36.4% | |
| q94 | 1.627 | 1.335 | 1.311 | -17.9% | -1.8% | -19.4% | |
| q95 | 3.700 | 3.047 | 2.948 | -17.6% | -3.2% | -20.3% | |
| q96 | 2.514 | 1.871 | 1.693 | -25.6% | -9.5% | -32.7% | |
| q97 | 13.412 | 10.849 | 8.461 | -19.1% | -22.0% | -36.9% | |
| q98 | 0.980 | 0.863 | 0.929 | -11.9% | +7.6% | -5.2% | ★ |
| q99 | 2.297 | 1.913 | 1.714 | -16.7% | -10.4% | -25.4% |
Scaling Conclusions and Recommendations
| Config | Warm Total | Warm GeoMean | Assessment |
|---|---|---|---|
| CN3 | 732.0s | 2.565s | Memory pressure, q67 bottleneck |
| CN4 | 481.1s | 2.198s | Optimal balance point |
| CN5 | 404.0s | 2.022s | Additional improvement, some regressions |
- CN4 → CN5 ROI: 16.0% improvement in warm_avg Total; 80% efficiency vs. +25% node cost. Absolute time reduction: 77.1s.
- CN3 is unfit for production: q67 warm at 164s is SLA-violating. q23 (93s) and q78 (61s) are also 2× worse than CN4.
- CN5 recommended when: workloads are heavy on complex aggregation/join queries. For simple small queries (under 1s), slight regressions on q44, q22, q21 etc. require checking applicable SLA requirements.
6.3 Trino Comparison
A comparison against the Trino Official benchmark was performed on the same SF-1000 scale.
Environment Comparison
| Item | Our (CN4) | Trino Official |
|---|---|---|
| Engine version | StarRocks 4.0.8 | Trino 475 |
| Node configuration | CN × 4 | Coordinator 1 + Worker 4 |
| vCPU/node | 15 cores | 16 cores |
| Memory/node | 50.9 GiB | 64 GiB |
| Storage | S3 Object Storage | NVMe SSD |
| Table format | Iceberg (Lakekeeper REST) | Iceberg Catalog |
| query_mem_limit | 35 GB/CN | 35 GB/Worker |
Key difference: Trino Official uses local NVMe SSD, while our setup uses S3 Object Storage (remote I/O). StarRocks substantially outperforms Trino even under S3's I/O disadvantage.
Overall Summary Comparison
| Metric | Our CN4 (Warm avg) | Trino Official | Ratio |
|---|---|---|---|
| Total | 481.1s | 2,552.1s | Our 5.30× faster |
| Geo Mean | 2.198s | 6.782s | Our 3.09× faster |
| Min | 0.134s (q41) | 0.271s (q41) | — |
| Max | 60.5s (q23) | 504.6s (q72) | — |
Our CN4 is 5.30× faster than Trino (Total basis). We had an advantage on 97 of 99 queries.
Top 10 Queries with Largest Advantage over Trino
| Query | Our (s) | Trino (s) | Speedup | Characteristic |
|---|---|---|---|---|
| q72 | 7.998 | 504.573 | 63.1× | catalog_sales + inventory + catalog_returns 3-way join |
| q54 | 1.044 | 31.864 | 30.5× | catalog/store/web_sales complex subquery |
| q11 | 7.508 | 133.230 | 17.7× | year-over-year self-join |
| q04 | 13.438 | 200.249 | 14.9× | 3 fact tables, 3-year range |
| q14 | 10.942 | 143.172 | 13.1× | store_sales 3× self-join |
| q74 | 6.147 | 78.071 | 12.7× | store_sales + web_sales year-over-year |
| q16 | 1.236 | 14.035 | 11.4× | catalog_returns + catalog_sales |
| q02 | 1.999 | 21.289 | 10.7× | web_sales + catalog_sales monthly comparison |
| q95 | 3.047 | 29.607 | 9.7× | web_sales + web_returns |
| q47 | 4.752 | 42.704 | 9.0× | store_sales window function |
Queries Where Trino is Faster
| Query | Our (s) | Trino (s) | Ratio |
|---|---|---|---|
| q40 | 2.371 | 1.554 | Trino 1.53× faster |
| q15 | 2.378 | 2.158 | Trino 1.10× faster |
Both q40 and q15 are simple catalog_sales date-filter queries. Trino's Iceberg file pruning appears to work more favorably for these specific access patterns.
Per-Query Our vs. Trino Comparison (Warm avg, in seconds)
Tri/Our: Higher = Our advantage
| Query | Our (s) | Trino (s) | Tri/Our | Notes |
|---|---|---|---|---|
| q01 | 1.578 | 2.276 | 1.44× | |
| q02 | 1.999 | 21.289 | 10.65× | |
| q03 | 0.807 | 1.764 | 2.19× | |
| q04 | 13.438 | 200.249 | 14.90× | |
| q05 | 1.846 | 5.574 | 3.02× | |
| q06 | 0.725 | 2.909 | 4.01× | |
| q07 | 1.759 | 3.638 | 2.07× | |
| q08 | 0.744 | 2.534 | 3.41× | |
| q09 | 24.829 | 36.125 | 1.45× | |
| q10 | 1.166 | 2.471 | 2.12× | |
| q11 | 7.508 | 133.230 | 17.75× | |
| q12 | 0.552 | 1.067 | 1.93× | |
| q13 | 2.513 | 18.297 | 7.28× | |
| q14 | 10.942 | 143.172 | 13.08× | |
| q15 | 2.378 | 2.158 | 0.91× | Trino faster |
| q16 | 1.236 | 14.035 | 11.36× | |
| q17 | 2.583 | 5.487 | 2.12× | |
| q18 | 2.120 | 4.736 | 2.23× | |
| q19 | 0.805 | 1.870 | 2.32× | |
| q20 | 0.481 | 1.257 | 2.61× | |
| q21 | 0.420 | 0.945 | 2.25× | |
| q22 | 5.062 | 7.871 | 1.55× | |
| q23 | 60.517 | 488.653 | 8.07× | |
| q24 | 7.239 | 43.436 | 6.00× | |
| q25 | 2.067 | 4.347 | 2.10× | |
| q26 | 1.126 | 2.961 | 2.63× | |
| q27 | 1.547 | 4.219 | 2.73× | |
| q28 | 14.915 | 24.678 | 1.65× | |
| q29 | 5.096 | 10.640 | 2.09× | |
| q30 | 1.433 | 2.770 | 1.93× | |
| q31 | 1.990 | 10.260 | 5.16× | |
| q32 | 0.462 | 1.035 | 2.24× | |
| q33 | 1.218 | 2.743 | 2.25× | |
| q34 | 1.042 | 2.455 | 2.36× | |
| q35 | 2.042 | 8.023 | 3.93× | |
| q36 | 1.657 | 3.342 | 2.02× | |
| q37 | 1.444 | 6.178 | 4.28× | |
| q38 | 5.107 | 38.408 | 7.52× | |
| q39 | 0.875 | 5.696 | 6.51× | |
| q40 | 2.371 | 1.554 | 0.66× | Trino faster |
| q41 | 0.134 | 0.271 | 2.02× | |
| q42 | 0.400 | 0.996 | 2.49× | |
| q43 | 0.806 | 4.108 | 5.10× | |
| q44 | 8.327 | 16.468 | 1.98× | |
| q45 | 1.142 | 2.212 | 1.94× | |
| q46 | 1.765 | 4.780 | 2.71× | |
| q47 | 4.752 | 42.704 | 8.99× | |
| q48 | 1.656 | 12.464 | 7.53× | |
| q49 | 1.953 | 3.827 | 1.96× | |
| q50 | 12.079 | 21.771 | 1.80× | |
| q51 | 6.118 | 12.247 | 2.00× | |
| q52 | 0.420 | 1.007 | 2.40× | |
| q53 | 1.098 | 1.768 | 1.61× | |
| q54 | 1.044 | 31.864 | 30.52× | |
| q55 | 0.419 | 1.187 | 2.83× | |
| q56 | 0.956 | 2.133 | 2.23× | |
| q57 | 3.640 | 26.042 | 7.15× | |
| q58 | 0.908 | 3.032 | 3.34× | |
| q59 | 3.841 | 20.819 | 5.42× | |
| q60 | 1.219 | 2.749 | 2.26× | |
| q61 | 1.574 | 2.054 | 1.30× | |
| q62 | 1.193 | 5.104 | 4.28× | |
| q63 | 1.081 | 1.719 | 1.59× | |
| q64 | 9.353 | 16.990 | 1.82× | |
| q65 | 12.367 | 20.616 | 1.67× | |
| q66 | 1.423 | 3.511 | 2.47× | |
| q67 | 42.965 | 89.430 | 2.08× | |
| q68 | 1.007 | 2.883 | 2.86× | |
| q69 | 1.139 | 2.181 | 1.91× | |
| q70 | 3.763 | 21.499 | 5.71× | |
| q71 | 1.910 | 2.578 | 1.35× | |
| q72 | 7.998 | 504.573 | 63.09× | |
| q73 | 0.832 | 1.933 | 2.32× | |
| q74 | 6.147 | 78.071 | 12.70× | |
| q75 | 13.602 | 26.270 | 1.93× | |
| q76 | 10.518 | 11.266 | 1.07× | |
| q77 | 1.095 | 2.785 | 2.54× | |
| q78 | 47.162 | 51.497 | 1.09× | |
| q79 | 2.118 | 5.572 | 2.63× | |
| q80 | 4.609 | 4.762 | 1.03× | |
| q81 | 1.453 | 4.040 | 2.78× | |
| q82 | 2.392 | 11.622 | 4.86× | |
| q83 | 0.811 | 2.274 | 2.80× | |
| q84 | 1.268 | 3.086 | 2.43× | |
| q85 | 2.048 | 5.424 | 2.65× | |
| q86 | 1.144 | 3.422 | 2.99× | |
| q87 | 5.091 | 41.300 | 8.11× | |
| q88 | 14.614 | 30.738 | 2.10× | |
| q89 | 1.378 | 2.227 | 1.62× | |
| q90 | 1.298 | 3.890 | 3.00× | |
| q91 | 0.805 | 2.035 | 2.53× | |
| q92 | 0.400 | 0.994 | 2.48× | |
| q93 | 6.319 | 22.926 | 3.63× | |
| q94 | 1.335 | 5.884 | 4.41× | |
| q95 | 3.047 | 29.607 | 9.72× | |
| q96 | 1.871 | 4.905 | 2.62× | |
| q97 | 10.849 | 22.726 | 2.09× | |
| q98 | 0.863 | 1.911 | 2.21× | |
| q99 | 1.913 | 10.970 | 5.73× |
7. Iceberg Partition Strategy Comparison
We tested whether the existing *_date_sk-based partitioning (1,823 partitions, ~20 MB per file) causes a Small Files Problem, and measured the performance difference against a no-partition + date_sk-sorted approach (Union method).
Experimental Conditions
| Item | Original | Union |
|---|---|---|
| Partitioning | *_date_sk (1,823 partitions) |
None |
| File sort order | PostgreSQL ctid order | date_sk ASC |
| File count (store_sales) | 1,823 × ~20 MB | ~56 × ~500 MB |
Overall Summary Results
| Metric | Original | Union | Difference |
|---|---|---|---|
| Warm avg Total | 481.1s | 538.6s | +11.9% |
| Warm avg Geo Mean | 2.198s | 2.396s | +9.0% |
| Per-query classification (±5%) | — | Improved 18 / Neutral 35 / Regressed 46 | — |
The Union method is generally worse than Original. The Small Files Problem is less severe than expected for two reasons.
First, DataCache absorbs small file I/O overhead starting from Warm runs. Since DataCache caches at the file level, even small files are fully cached on re-execution. The "large file" advantage of Union in Cold runs disappears in Warm runs.
Second, StarRocks' DPP (Dynamic Partition Pruning) operates effectively even with 1,823 partitions. In the Union approach, the absence of partition metadata forces fallback to Iceberg file-level statistics (min/max) for pruning, which is significantly less efficient. In particular, the inventory table (4 columns) has only 4–10 files under Union, making file-level pruning nearly ineffective, resulting in severe regressions on q21 (+149%), q39 (+101%), and q72 (+162%).
Conclusion: The Original partition strategy (*_date_sk) is optimal for the current environment.
8. Issues and Resolutions
Key issues encountered during the benchmark and how they were resolved:
| # | Issue | Cause | Resolution |
|---|---|---|---|
| 1 | OOM during dat generation | Insufficient memory generating SF-1000 Fact table dat files | Split Fact table dat files into 8 parts |
| 2 | PostgreSQL load interrupted | catalog_sales load stopped at chunk 14 | Used resume_sf1000.py to resume from chunk 15 |
| 3 | PG→Iceberg block I/O spike | ORDER BY date column causing full heap random access in PostgreSQL | Switched to ctid-based chunk-split parallel read |
| 4 | Spark Executor out of disk space | K8s pod ephemeral storage limit exceeded | Explicitly set ephemeral-storage 30Gi/50Gi |
| 5 | CN node memory config variable | exec_mem_limit variable does not exist in this version |
Changed to query_mem_limit (already applied) |
| 6 | q78 OOM | Hash Join memory overflow between large Fact tables | Applied enable_spill=true for q78 only |
| 7 | DataCache coverage at 19% | datacache_max_flying_memory_mb=2 setting |
Recommend increasing to 2048 (requires kubectl access) |
9. Full Results Summary
9.1 Batch ELT Results
| Item | SF-100 | SF-1000 |
|---|---|---|
| Tables | 24 | 24 |
| Total rows | 960M | 6.3B |
| Load time | 54 min | 72.9 min |
| Throughput | 296K rows/sec | 1,451K rows/sec |
| Data integrity | 100% | 100% |
9.2 Query Performance Results (CN4 baseline)
| Run | Queries | Pass Rate | Geometric Mean | Total Time |
|---|---|---|---|---|
| Cold | 99 | 100% | 4.376s | 837.7s |
| Warm (3-run avg) | 99 | 100% | 2.198s | 481.1s |
9.3 CN Scaling Results
| CN Config | Warm Geo Mean | Warm Total | vs. CN3 |
|---|---|---|---|
| CN3 | 2.565s | 732.0s | baseline |
| CN4 | 2.198s | 481.1s | -34.3% |
| CN5 | 2.022s | 404.0s | -44.8% |
9.4 Trino Comparison Results
| Comparison | Total | Geo Mean | Primary Cause |
|---|---|---|---|
| Our vs. Trino | Our 5.30× faster | Our 3.09× faster | StarRocks query engine optimization |
9.5 Key Performance Metrics
Benchmark results summarized from three perspectives:
① Composite Performance Metric: QphDS@1000
| Item | Value |
|---|---|
| Formula | SF × 3,600 / GeoMean (seconds) |
| SF | 1,000 |
| GeoMean (Warm avg, CN4) | 2.198s |
| QphDS@1000 | 1,637,853 |
Calculation:
1,000 × 3,600 / 2.198 = 1,637,853. This is approximately 6.7× higher than QphDS@100 (244,234) from SF-100, demonstrating that performance degraded only 1.5× despite a 10× scale factor increase.
② Perceived Performance Metric: Query Geometric Mean
| Item | Value |
|---|---|
| GeoMean (Cold, CN4) | 4.376s |
| GeoMean (Warm avg, CN4) | 2.198s |
| GeoMean (Warm avg, CN5) | 2.022s |
| vs. Trino | 3.09× faster |
Achieving under 2.2s average response on Warm runs against 1 TB on S3 Object Storage is a level that fully supports interactive analyst query workflows.
③ Scale Efficiency Metric: SF-100 → SF-1000
| Metric | SF-100 | SF-1000 | Ratio |
|---|---|---|---|
| Data scale | 960M rows / 30 GB | 6.3B rows / 1 TB | ×10 |
| Ingestion throughput | 296K rows/sec | 1,451K rows/sec | ×4.9 |
| Query GeoMean | 1.474s | 2.198s | ×1.49 |
| QphDS | 244,234 | 1,637,853 | ×6.7 |
With a 10× data increase, query response time grew by only 1.5×, achieving sub-linear scaling.
10. Conclusions and Recommendations
10.1 Conclusions
Batch ELT completed loading 24 tables and 6.3B rows into Iceberg in approximately 73 minutes at SF-1000 scale (1,451K rows/sec). This is a 4.9× throughput improvement over SF-100 (296K rows/sec), confirming the effectiveness of ctid-based chunk-split parallel reads and large-scale JDBC partitioning.
Query performance achieved 100% pass rate on all 99 TPC-DS queries with a Geometric Mean of 2.198s (CN4 Warm). Despite a 10× data increase, GeoMean grew only 1.5×, validating the scalability of StarRocks' MPP architecture and Iceberg partition pruning. Performance was 5.3× faster than Trino despite the inherent disadvantage of S3 storage.
CN scaling confirmed CN4 as the optimal cost-performance balance point. CN3→CN4 achieved super-linear improvement (137% efficiency), while CN4→CN5 showed diminishing returns (80% efficiency) due to S3 I/O bounds. CN3 is deemed unfit for production due to SLA-violating bottlenecks on q67 (164s).
Partition strategy: the Original (*_date_sk partitioning) is broadly superior to Union (no partitions), because DataCache effectively absorbs small file I/O overhead and DPP operates accurately across all 1,823 partitions.
10.2 Recommendations
| Item | Recommendation |
|---|---|
| CN node configuration | Minimum CN4 recommended; CN3 is unfit for SF-1000 production use |
| DataCache optimization | Increase datacache_max_flying_memory_mb to 2048 → expected to close Cold/Warm gap |
| q78 Spill | Keep enable_spill=true (prevents Hash Join memory overflow) |
| Partition strategy | Maintain *_date_sk-based partitioning |
| CN memory increase | query_mem_limit=62 GiB |
This benchmark was conducted on the DIP v1.0 platform. Results may vary depending on environment and configuration.